Fetch.ai (FETUSD) Buyers Hold On to Their Strong Support Price After Triggering Bearish Aggression
Estimated Reading Time: 3 minutes
Don’t invest unless you’re prepared to lose all the money you invest. This is a high-risk investment and you are unlikely to be protected if something goes wrong. Take 2 minutes to learn more
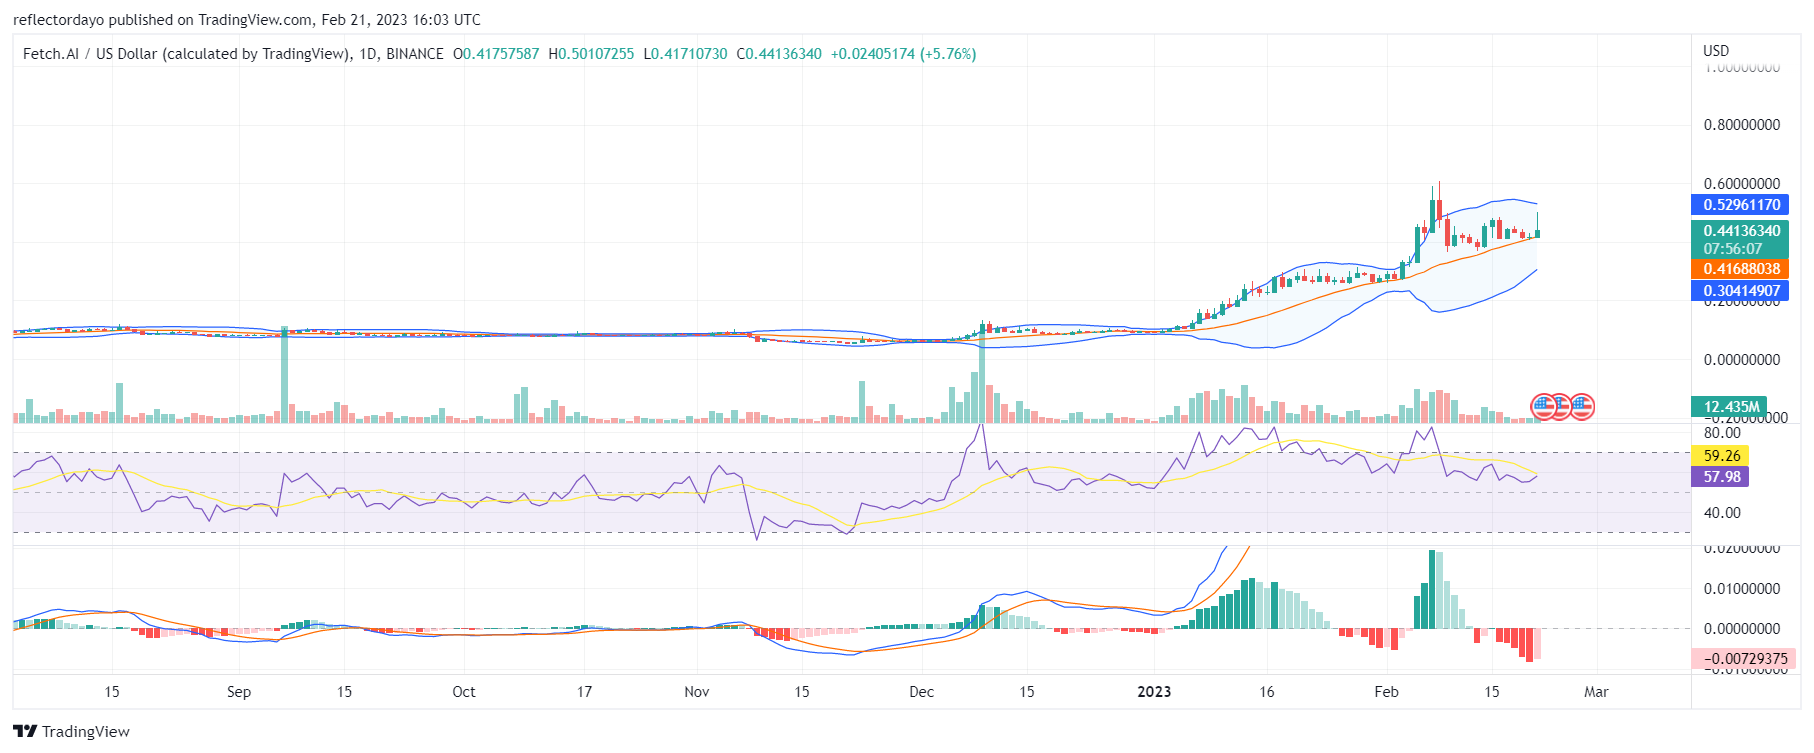
The Fetch.ai (FETUSD) bear market appears to have been triggered as the price got closer to $0.6. After the bullish price got rejected at around the $0.6 price level, another lower resistance level was also formed at the $0.48 price level. This appearance of lower highs in the market might be an indication that the sellers are gaining more control over it. However, in the territory of the bulls, which is the $0.41 price level, they seem very strong. The bearish price has continuously failed to go beyond this price line for the past few days’ trading sessions. But with the supply line shifting closer to the support level, the tension on this bullish position is under attack. Another possibility for the market at this time is that we may begin to see consolidation prices due to indecision. This is because sellers are not yet fully in control; rather, they are hot on the trail of the buyers.
FET/USD Price Statistic
- FET/USD price now: $0.45
- FET/USD market cap: $359,065,891
- FET/USD circulating supply: 818,912,300 FET
- FET/USD total supply: 1,152,997,575
- FET /USD coin market cap rank: #119
Key Levels
- Resistance: $0.60, $0.65, $0.70
- Support: $0.30, $0.25, $0.20
Price Prediction for Fetch.ai: the Indicators’ Point of View – The Forces Are Matching Up
Although it may appear as though the market is taking a downward turn, according to the Bollinger Bands indicator, the overall direction of the market, when you look at the price channel, is still to the upside. However, because of the reaction of the bears at the $0.6 price level, the upper band now recoils as the two bands converge. This reflects increasing tension that may result in indecision. The price is falling back to the 20-day moving average as the two standard deviation curves converge against it.
FET/USD 4-Hour Chart Outlook
On the short-term outlook, indecision seems to have already reached its peak, but as a sign that more traders may still be willing to buy than sell, we noticed a slight price breakout to the upside. But this bullish victory appears to be short-lived as the market is back at the equilibrium price. Bears and bulls are at a deadlock again. The bull market, however, may have a bit of an advantage as they can draw strength from the market force that has brought the market to the $0.6 price level.