Bitcoin (BTC/USD) Market Has Pushed Past $22,500
Estimated Reading Time: 3 minutes
Don’t invest unless you’re prepared to lose all the money you invest. This is a high-risk investment and you are unlikely to be protected if something goes wrong. Take 2 minutes to learn more

Free Crypto Signals Channel
Bitcoin Price Prediction – July 20
The BTC/USD trade has touched a high of $23,622, showcasing the crypto market has pushed past the $22,500 line, which is also considered one of the psychological points to the upside. Price is currently enjoying positive signs of getting more increases, probably in the near time.
BTC/USD Market
Key Levels:
Resistance levels: $25,000, $27,500, $30,000
Support levels: $20,000, $17,500, $15,000
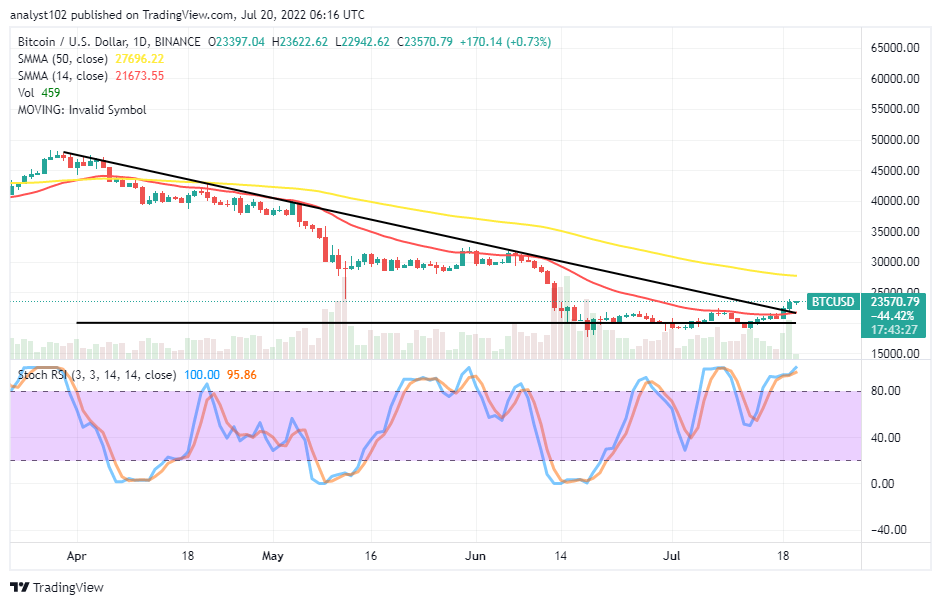
BTC/USD – Daily Chart
The BTC/USD daily chart reveals the crypto market has pushed past the $22,500 level. The 14-day SMA trend line is at $21,673 underneath the 50-day SMA trend line. The bearish trend line drew southward, touching the strategic points that the price has been losing momentum to the downside around the smaller SMA. The Stochastic Oscillators are in the overbought region, swinging more into an upward direction than downwards.
Has there been any negative signal in the BTC/USD market as it trades above $22,500?
It is apparent that the BTC/USD market has pushed past the $22,500 level, and there has not been a significant negative signal to suggest the possibility of witnessing a correction in the motions as of writing. Being as it is, bulls tend to dominate the trade’s control for a while. The only challenge buyers will face; is the entry point over the value line. Nevertheless, they should be wary of when the market aims to reverse against the 14-day SMA at $21,673. A sudden fearful reversal against it may invalidate upward swings afterward.
On the downside of the technical analysis, bulls’ pressures tend to rise as of writing over the $22,500 level. The BTC/USD market sellers have to exercise caution until a bearish candlestick emerges, probably around the $25,000 or $27,696 values, seems the price will exhaust its strength further to the north side in the ongoing operations until the following days.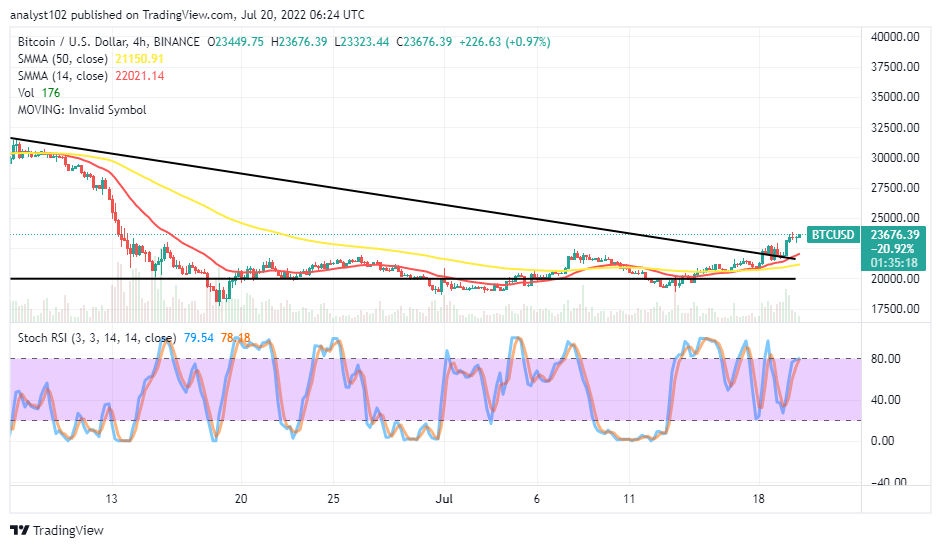
BTC/USD 4-hour Chart
The BTC/USD medium-term chart reveals the crypto market has pushed past the $22,500 level over the SMA trend lines. Initially, the price encountered a rejection around the point on the 18th session, but it hiked to break it on the following day to set on a journey to the moon in a gradual mode. The 14-day SMA indicator has intercepted the 50-day SMA indicator. The bigger SMA is at $21,150, while the smaller SMA is at $22,021. The Stochastic Oscillators are around the 80 range, seemingly trying to close the lines around it. But, from all indications, bulls may run a rallying motion through some other resistances in a slow-and-steady manner to make up for the part of their lost positions.
Note: Cryptosignals.org is not a financial advisor. Do your research before investing your funds in any financial asset or presented product or event. We are not responsible for your investing results.
“Lucky is up more than 50% today but still more than 430% from All Time Highs!
The opportunity to bank BIG is now!
You can purchase Lucky Block here. Buy LBlock