Ethereum (ETH/USD) Price Precipitates, Hitting $3,000 Resistance
Estimated Reading Time: 3 minutes
Don’t invest unless you’re prepared to lose all the money you invest. This is a high-risk investment and you are unlikely to be protected if something goes wrong. Take 2 minutes to learn more

Free Crypto Signals Channel
Ethereum Price Prediction – March 7
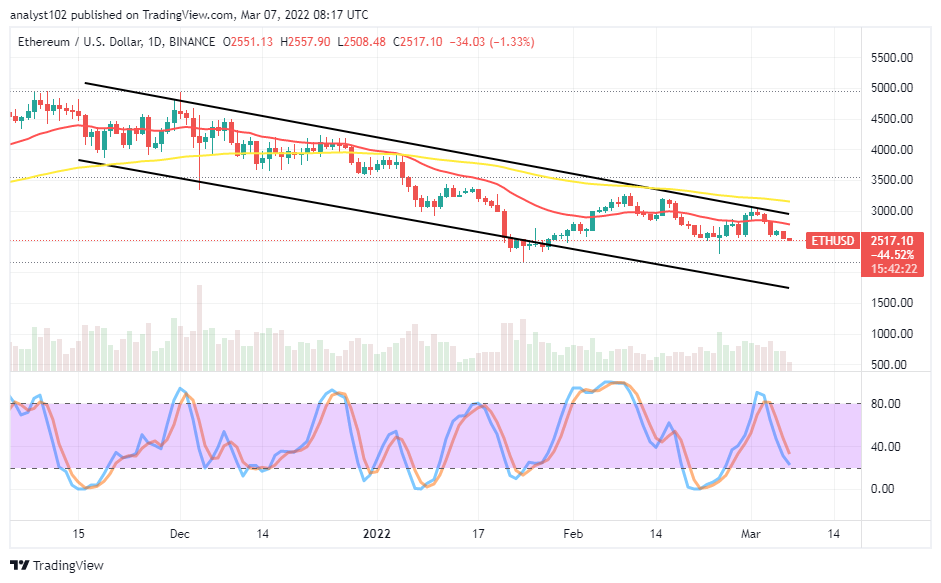
About a couple of days back, the ETH/USD market pumps higher, propelling buying positions for an abrupt increase in valuation. Presently, the crypto-economic price precipitates after hitting $3,000 resistance afterward. The market trades around $2,517 between high and low trading value-lines of $2,557 and $2,508 at a percentage of 1.33 negatives.
ETH/USD Market
Key Levels:
Resistance levels: $2,750, $3,000, $3,250
Support levels: $2,250, $2,000, $1,750
ETH/USD – Daily Chart
The ETH/USD daily chart reveals the crypto-economic price precipitates, hitting the $3,000 resistance level. The 50-day SMA indicator is above the 14-day SMA indicator. On March 5th, a smaller bullish candlestick emerged to denote a pit-stop in the downing process. The subsequent days have witnessed a move on a slow-and-steady pattern to the downside. The Stochastic Oscillators are moving southbound closely to the range of 20, which affirms the downing force is ongoing.
Is it the right time to begin to look for a buying position as the ETH/USD market price precipitates after hitting $3,000 resistance?
It still appears that the condition to warrant the right time for a long-position taking has been piling up on a gradual approach as the crypto-economic price precipitates after hitting resistance around $3,000 about a couple of days back. Bulls will now have to resettle for finding support at a lower trading level in the process of the current downward trend getting exhausted. Bulls may resume energy gathering around the $2,500 and $2,250 levels after a while.
On the downside of the technical analysis, the ETH/USD market short-position placers may have to be cautious of exerting further sell orders around the $2,500 as there can be an untimely bounce-off in no time. Therefore, it would be necessary that traders be on the lookout for a respite of the crypto economy gaining momentum toward a higher point to observe a sign of returning into a downward-trending motion around $2,800 before considering a sell order.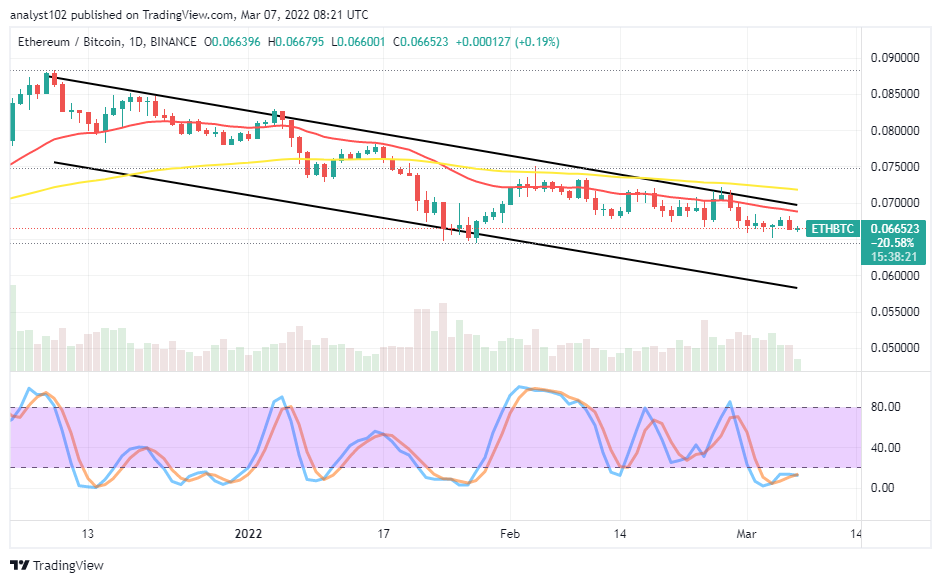
ETH/BTC Price Analysis
In comparison, Ethereum appears to push underneath the trend line of the smaller SMA indicator as placed alongside Bitcoin. The cryptocurrency pair price precipitates in a continual downward-trending motion underneath the SMAs. The 50-day SMA indicator is above the 14-day SMA indicator. The Stochastic Oscillators are in the oversold region, seemingly attempting to conjoin to denote a consolidation moving style. That means the current situation is yet to see the base crypto regaining strength against the flagship counter crypto.
Note: Cryptosignals.org is not a financial advisor. Do your research before investing your funds in any financial asset or presented product or event. We are not responsible for your investing results.
You can purchase Lucky Block here. Buy LBlock: