Fetch.ai (FETUSD) Fell Below the Decision Level
Estimated Reading Time: 3 minutes
Don’t invest unless you’re prepared to lose all the money you invest. This is a high-risk investment and you are unlikely to be protected if something goes wrong. Take 2 minutes to learn more
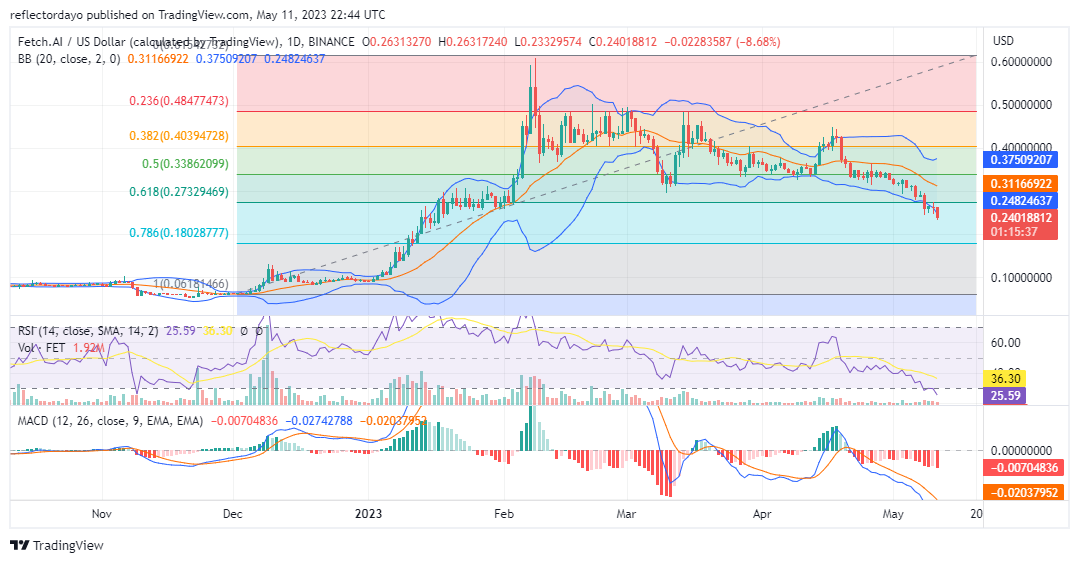
In early February, Fetch.ai hit its all-time high of $0.600. After hitting the high, a strong bearish trend was triggered. But the bull market remains formidable and was able to slow down the bearish trend. On March 1, the market made another high, but it was a lower high, which is at $0.500. At this new price, bearish sentiment grew stronger again, and the market declined due to massive selling. The bear eventually encountered a strong support level at $0.027. This should form the basis for the next bullish cycle.
FET/USD Price Statistics
- FET/USD Price Now: $0.24
- FET/USD Market Cap: $200,040,380
- FET/USD Circulating Supply: 819,841,824 FET
- FET/USD Total Supply: 1,152,997,575
- FET/USD CoinMarketCap Ranking: #144
Key Levels
- Resistance: $0.31, $0.37, and $0.40
- Support: $0.21, $0.20, and $0.19
Price Prediction for Fetch.ai: The Indicators’ Point of View
The multiple appearances of lower highs suggest a growing bearish sentiment in the market. The sellers drove the price to the $0.27 price level, which was the point at which the bulls faced much resistance in the bull market of early January. It is also the 61% Fibonacci level. Therefore, one could expect the market to bounce or range sideways at this level. However, neither of these was the case, as the market fell below the price level. But there is still the possibility that the market might bounce back into action at a slightly lower price level. Observations from the Relative Strength Index (RSI) reveal that the market is going into the oversold region, and because of this, the bulls began to enter the market, and the Bollinger Bands indicator started showing an increase in volatility, which could be a sign that a bullish price recovery is in progress.
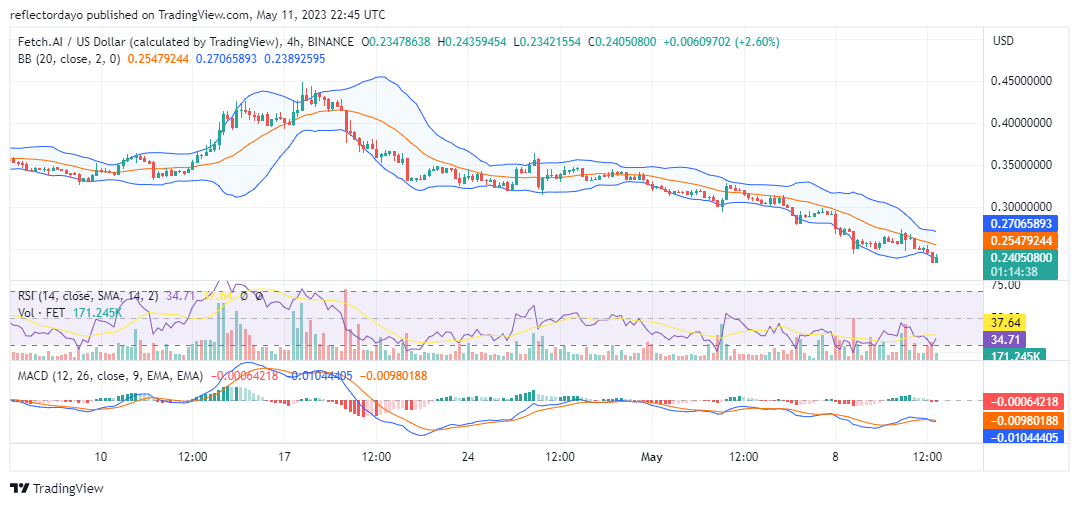
FET/USD 4-Hour Chart Outlook: Bullish Recovery In Progress
The downtrend is vivid on a 4-hour chart of the market. The downward-moving bands of the Bollinger Bands indicator could as well represent the bearish price channel. But as the market hit the $0.25 price level, the forces of demand became evenly matched with the forces of supply. It was expected that the market would bounce back at this level. But the Fetch.ai buyers lost grip on the support level, and they had to find a lower support level. Bullish sentiment should grow around this level.