Quant Price Prediction: QNT/USD Slides Below $130; Could This Be An Entry Point for Buyers?
Estimated Reading Time: 3 minutes
Don’t invest unless you’re prepared to lose all the money you invest. This is a high-risk investment and you are unlikely to be protected if something goes wrong. Take 2 minutes to learn more
Quant Price Prediction – March 15
The Quant price prediction reveals that QNT will begin to form higher as the coin prepares for the bullish movement.
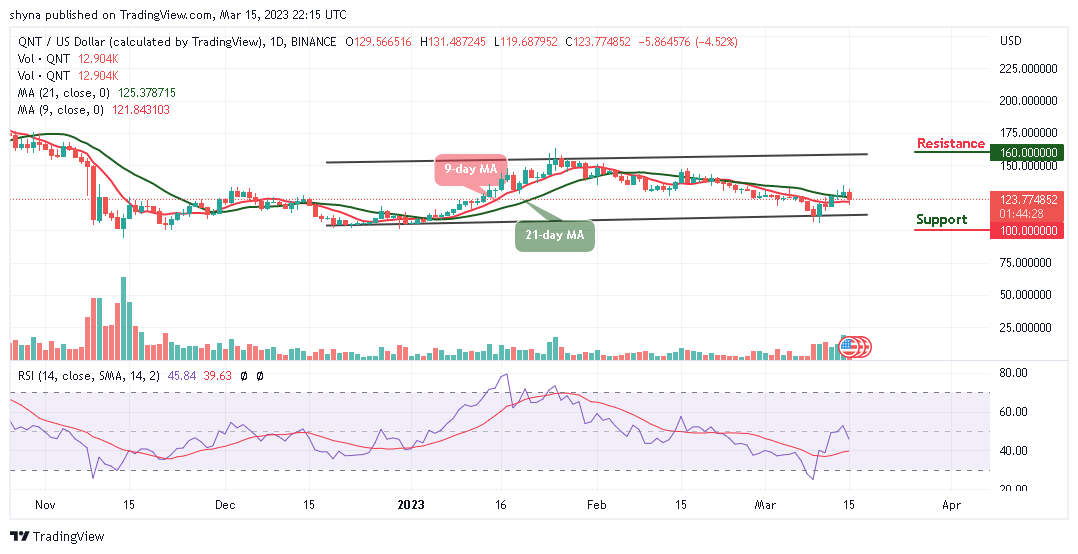
QNT/USD Medium-term Trend: Ranging (1D Chart)
Key Levels:
Resistance levels: $160, $170, $180
Support levels: $100, $90, $80
QNT/USD is moving to cross below the 9-day and 21-day moving averages, but it’s yet to get head to the upside. At the time of writing, the market price is hovering at $123.77 after touching the daily low of $119.68, and it could become lower to allow new investors to come into the market.
Quant Price Prediction: QNT/USD Will Retrace Back to the Top
The Quant price will make a retracement back above the 9-day and 21-day moving averages after the bulls defend the $120 support. However, the coin will begin to follow the upward movement by staying above the moving averages; any further bullish movement could push the coin towards the upper boundary of the channel which could hit the potential resistance levels of $160, $170, and $180 respectively.
On the contrary, the bullish movement could be delayed if the bears break below the lower boundary of the channel and fall to the support levels of $100, $90, and $80. Nevertheless, the technical indicator Relative Strength Index (14) is seen crossing the 50-level, this could prepare the coin for the bullish movement in the next positive direction.
QNT/USD Medium-term Trend: Bearish (4H Chart)
Looking at the 4-hour chart, the Quant price is heading toward the north as the coin moves to cross above the 9-day and 21-day moving averages. The new buyers can come into the market while the existing buyers are to re-invest. However, the long-term moving averages will begin the bullish movement as the market prepares for a new trend.
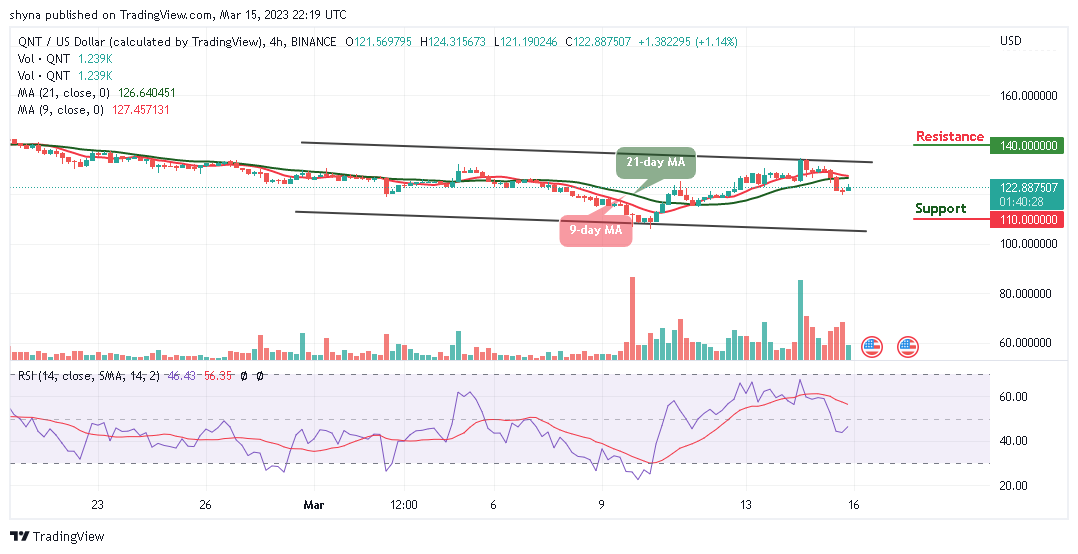
Moreover, if the buyers push the price above the moving averages, it could reach a potential resistance level of $140 and above. At the moment, the technical indicator Relative Strength Index (14) is likely to cross above the 50-level, but if the bulls fail to move the current market value upward, the bears could bring the coin to the support level of $110 and below.
Place winning Quant trades with us. Get QNT here