Hedera Hashgraph (HBARUSD) In Hot Pursuit of the Key Resistance Level
Estimated Reading Time: 2 minutes
Don’t invest unless you’re prepared to lose all the money you invest. This is a high-risk investment and you are unlikely to be protected if something goes wrong. Take 2 minutes to learn more
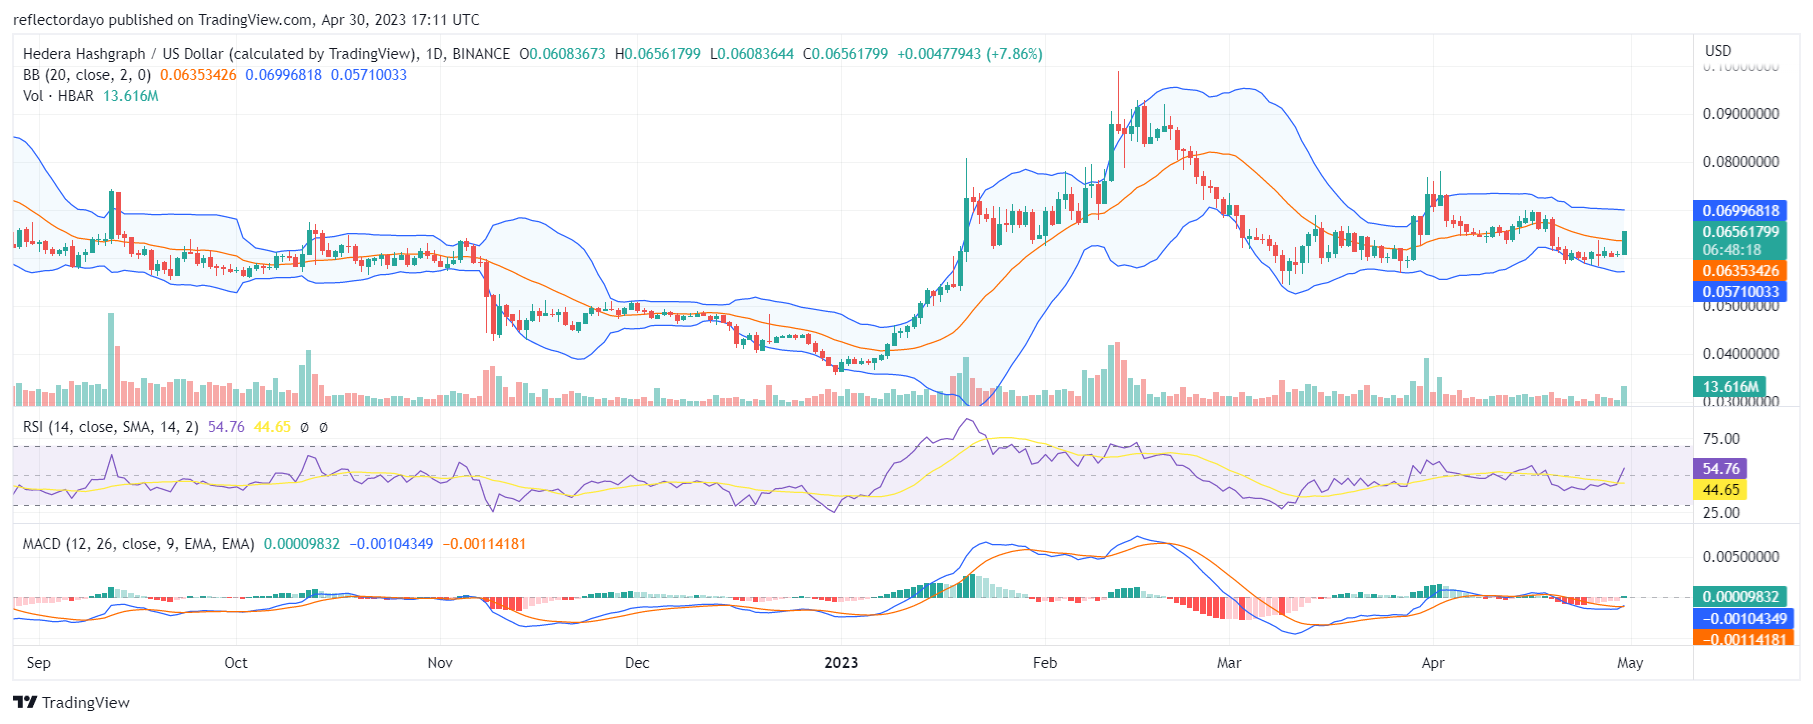
After the formation of resistance at the $0.0735 price level, another lower high formed at 0.0700, giving the impression that the Hedera Hashgraph market may be on the decline due to bearish sentiment. But it looks like the bulls have found a strong demand point at the $0.06 price level, and after a very strong faceoff between the bulls and bears around the key demand level, in today’s market, the market breaks out to the upside significantly. The market is now currently on the trail of the $0.0735 price level, which is the resistance price of April 17.
HBAR/USD Price Statistics
- HBAR/USD Price Now: $0.0654
- HBAR/USD Market Cap: $73,511,144
- HBAR/USD Circulating Supply: 31,242,867,534
- HBAR/USD Total Supply: 50,000,000,000
- HBAR/USD CoinMarketCap Ranking: #31
Key Levels
- Resistance: $0.07, $0.075, and $0.08.
- Support: $0.057, $0.050, and $0.045
Price Prediction for Hedera Hashgraph: The Indicators’ Point of View
There is liquidity in the bull market, while the bear market seems to have very little activity. The buyers are in control, and this is forcing the price toward the $0.07 level. The bullish activities of today’s trading session have also brought the market above the 20-day moving average. In the Relative Strength Index (RSI), the momentum level of the market has now increased to around 53.94. This measurement is still not strong enough, but it is increasing by the minute. It is time to buy, however, the bulls might be forming a new higher support level in the next trading session to support the price pump.
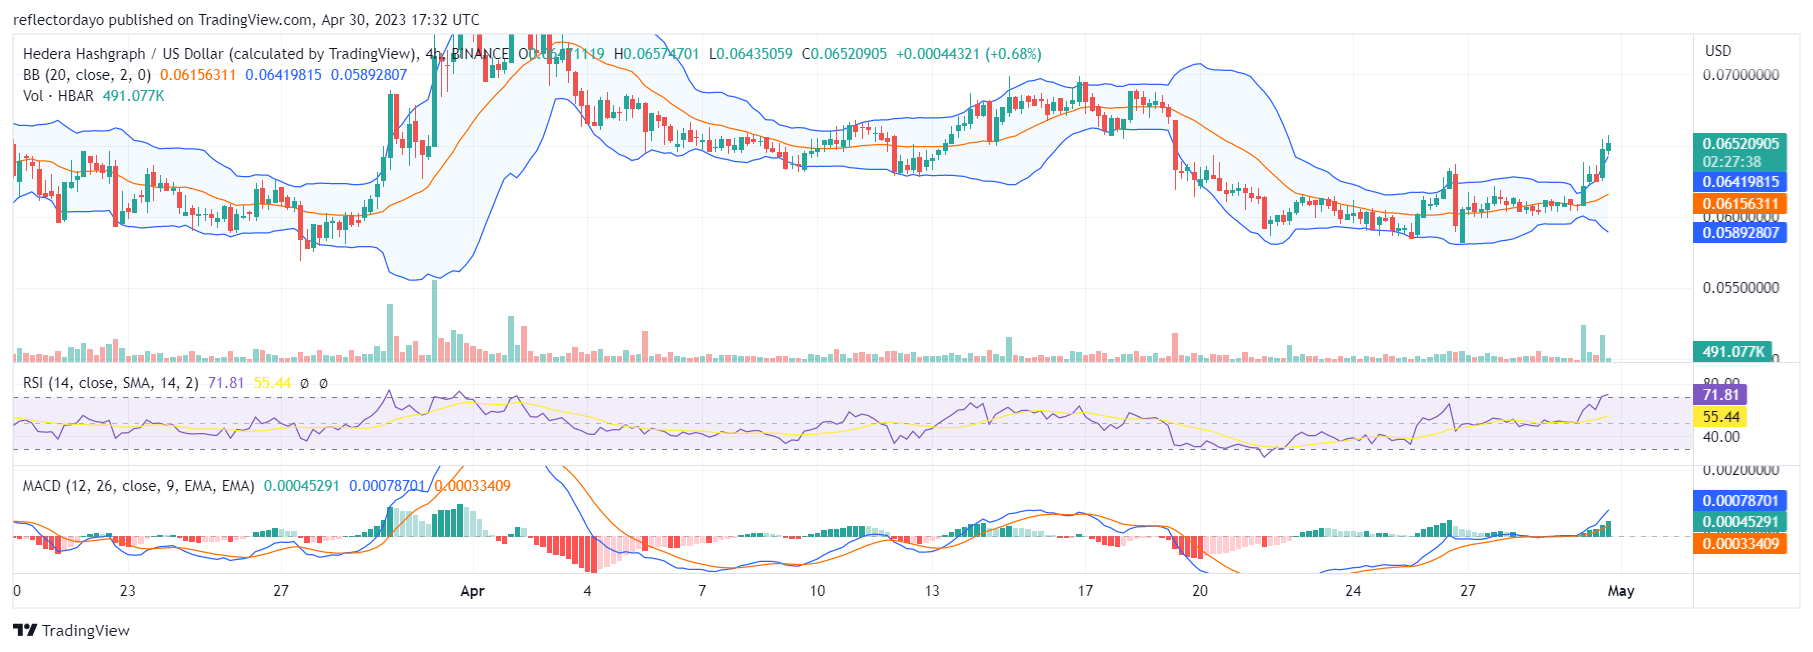
HBAR/USD 4-Hour Chart Outlook:
Looking at the market from this standpoint, it looks like the bullish trend may be slowing down, as we can see a reduction in the volume of trade. Also, while the Moving Average Convergence and Divergence (MACD) indicator points to a very bullish sentiment, the Bollinger Bands indicator points to the possibility of the market currently being overbought as the price action now shoots out of the bands. The bulls might be securing a suitable demand level to carry on the bullish trend.