Helium (HNT/USD) Makes a Notable Recovery
Estimated Reading Time: 3 minutes
Don’t invest unless you’re prepared to lose all the money you invest. This is a high-risk investment and you are unlikely to be protected if something goes wrong. Take 2 minutes to learn more

The Helium market is staging a remarkable recovery in today’s trading session. Observing the daily chart, the broader price action remains in consolidation, with no clear directional bias established yet. In recent sessions, HNT slipped below the key $2.00 level, but strong buying interest reemerged around the $1.28 support zone.
This renewed bullish sentiment has driven today’s impressive 23% price surge. However, as the market approaches the $2.50 resistance area, bearish traders who previously exited the market are likely to become active again. This level may pose a challenge to sustained upward momentum.
Helium (HNT/USD) Market Data
- HNT/USD Price Now: $2.256
- HNT/USD Market Capitalization: $421 million
- HNT/USD Circulating Supply: 186 million HNT
- HNT/USD Total Supply: 186 million HNT
- HNT/USD CoinMarketCap Ranking: #108
Key Levels to Watch
- Resistance: $2.50, $3.00, $3.50
- Support: $1.80, $1.60, $1.40
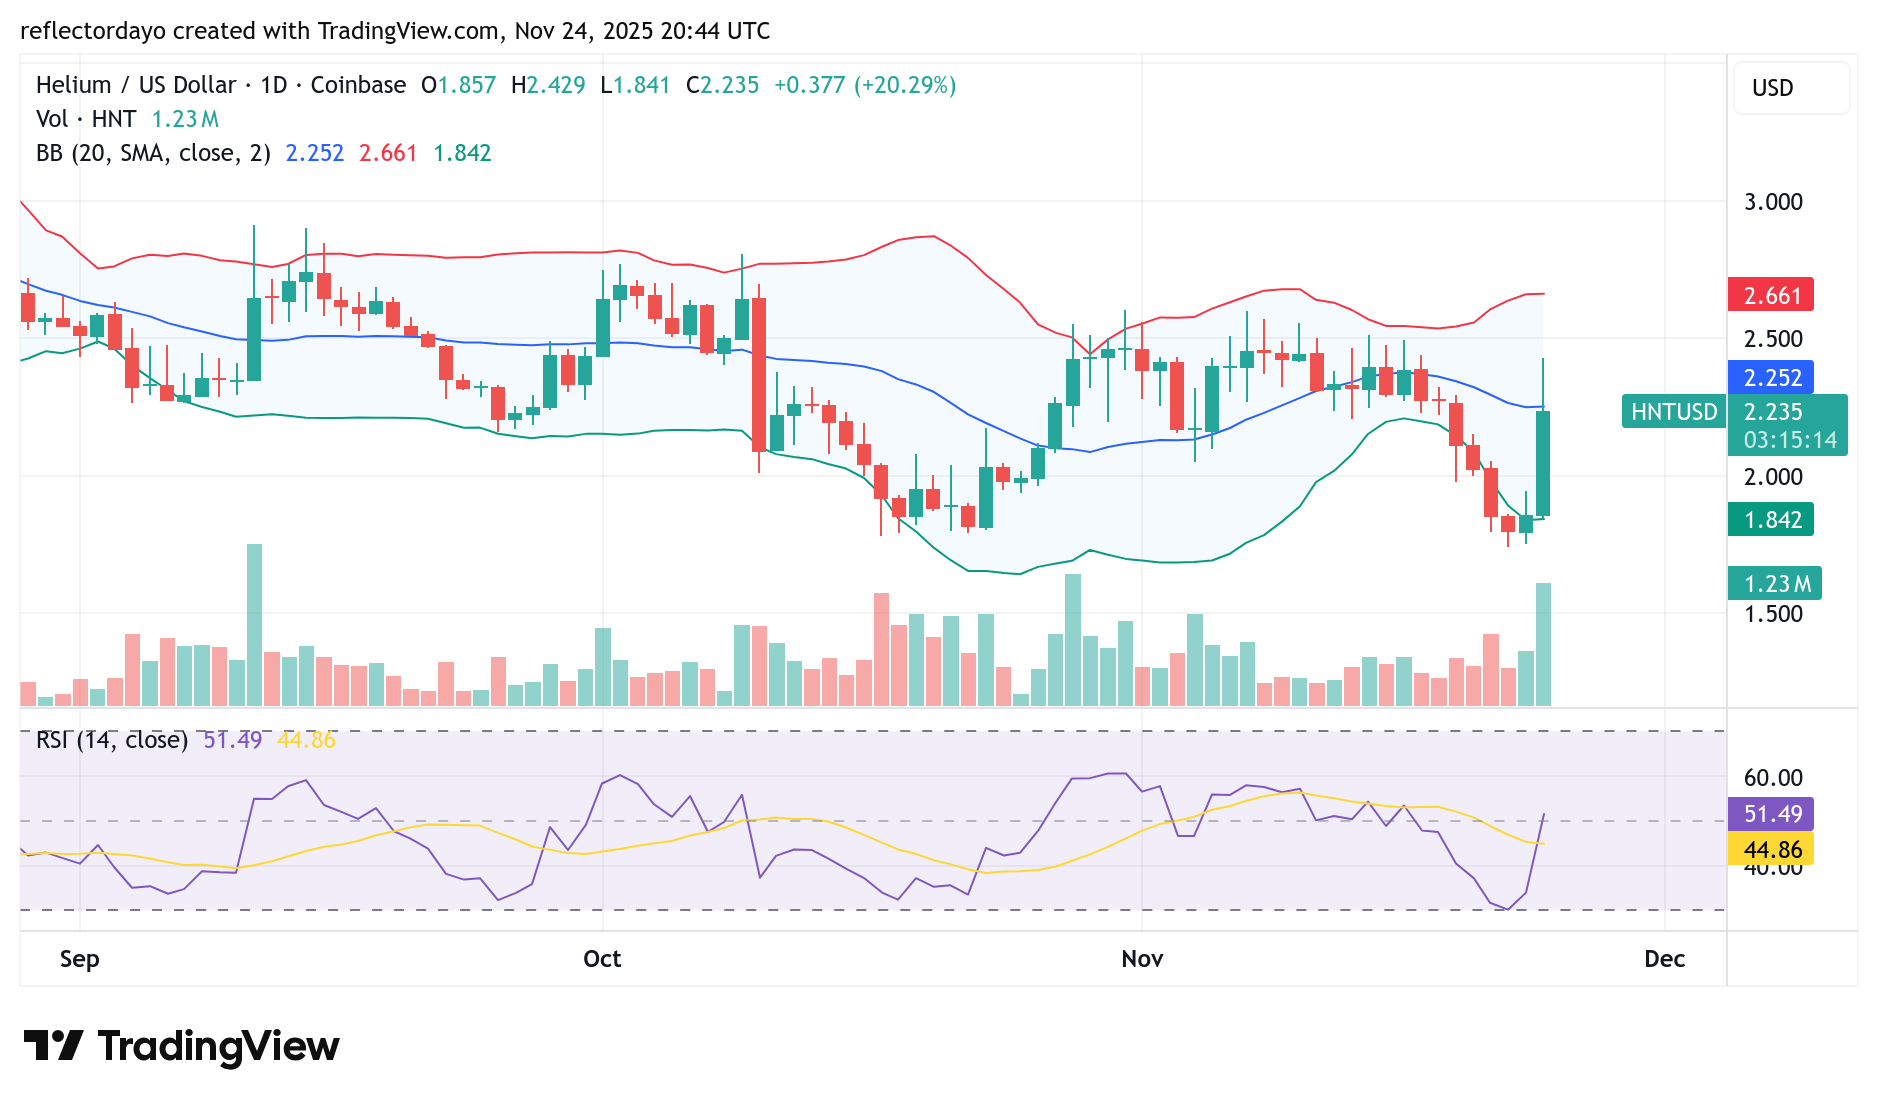
Helium (HNT/USD) Daily Chart Analysis
In today’s trading session, Helium has recorded a strong bullish advance after rebounding from the key $1.80 support zone. Once the price broke above the $2.00 level, buying pressure intensified, attracting additional bullish interest that propelled the market further upward.
The bullish momentum carried price action toward the $2.50 resistance area, where sellers became active once again. Profit-taking began near this level—specifically around $2.435—prompting a pullback. Currently, the price has retreated toward the 20-day moving average, suggesting a potential pause in momentum.
The Relative Strength Index (RSI) stands at 52, indicating that the market is hovering around a point of equilibrium, with both demand and supply competing to establish the next directional move.
For a stronger bullish continuation to take shape, a clean break above the $2.50 resistance level is essential. A successful breakout would signal renewed upside strength and could mark the beginning of a fresh upward trend.
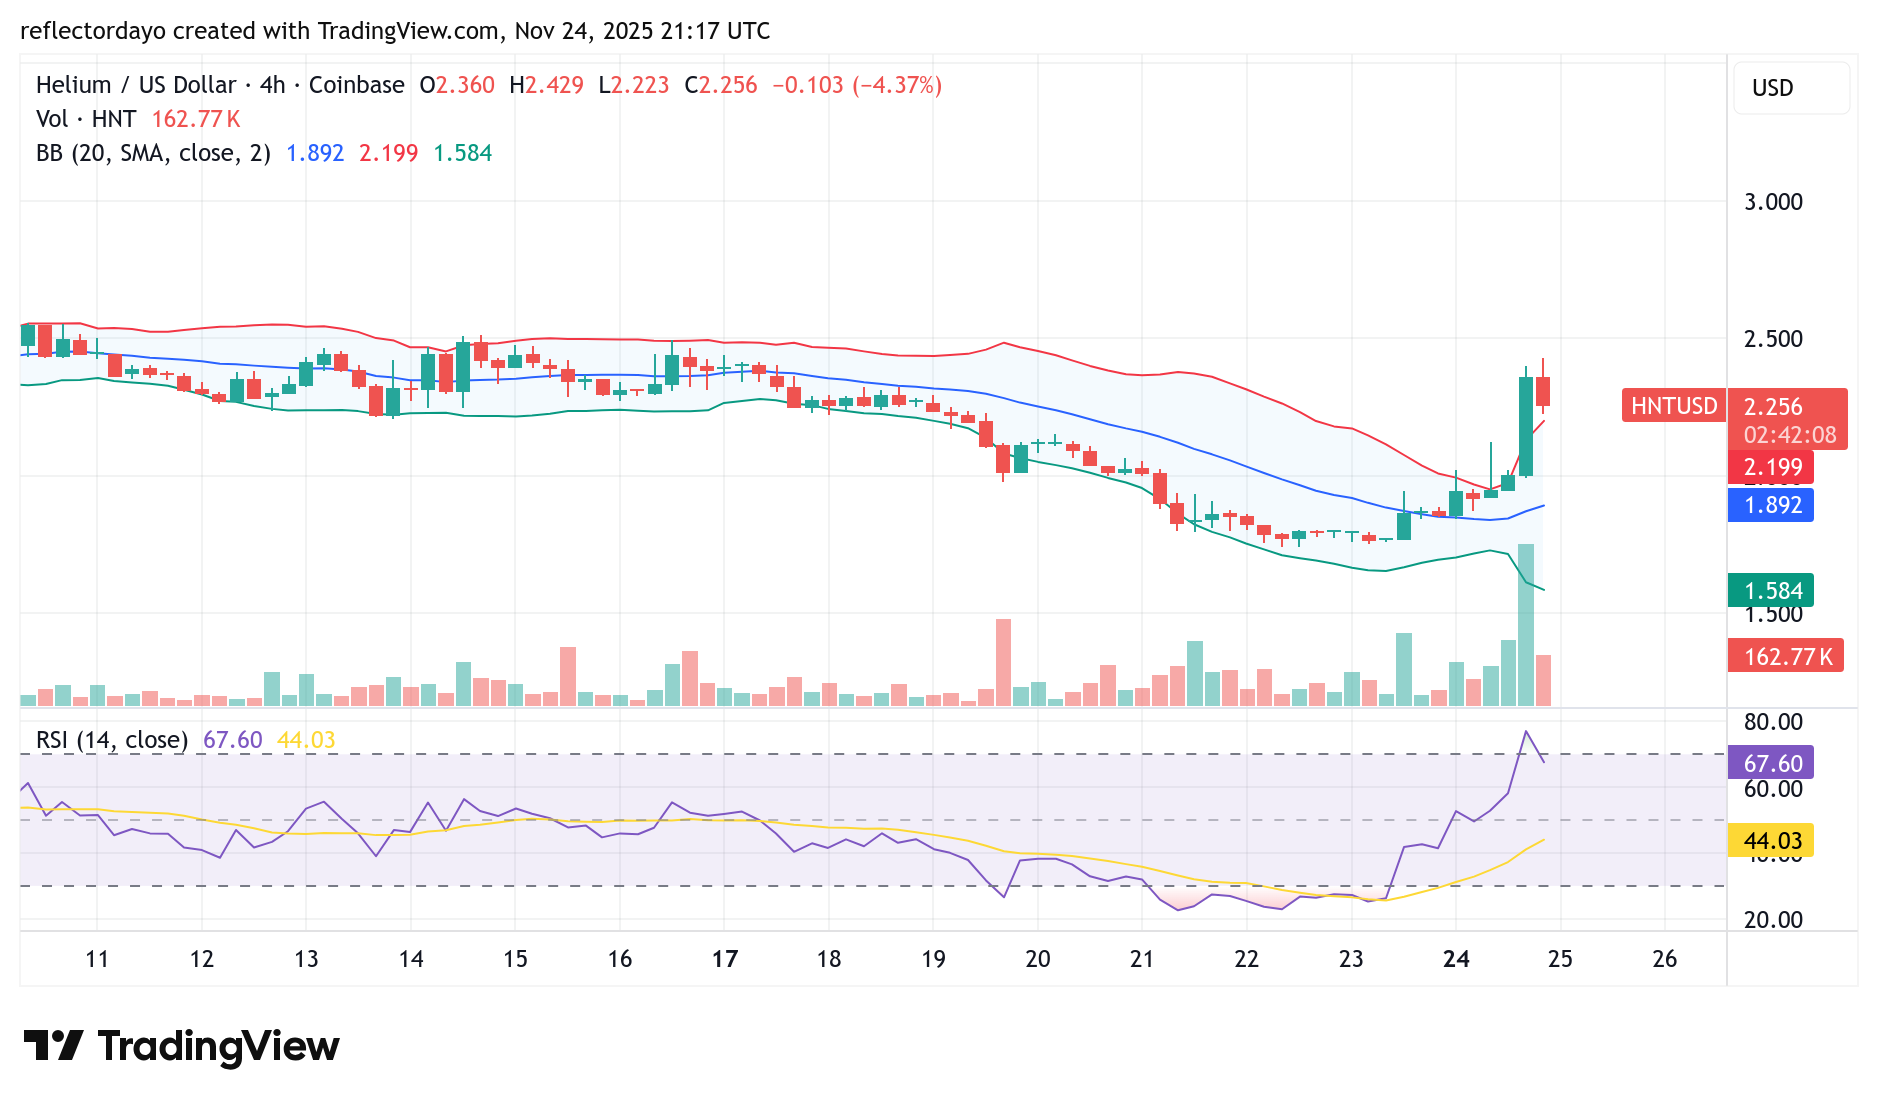
HNT/USD 4-Hour Chart Outlook
On the 4-hour timeframe, the market reveals a clearer view of the recent bullish momentum. Indicators show that Helium remains in overbought territory. The Bollinger Bands confirm this, as the latest price action extends outside the upper band—reflecting the strength of today’s bullish surge.
Following the strong upside move and the market’s encounter with a key resistance zone, a pullback has begun, accompanied by a noticeable decline in trading volume. This reduction in volume suggests a period of rest or consolidation as traders reassess their positions.
The next trading sessions will be crucial in determining whether the bullish recovery continues or whether the market enters a deeper correction. For now, however, buyers still maintain a slight advantage, as overall sentiment remains tilted toward the upside.