Injective Protocol (INJ/USD) Breaks Through $24.00, Eyes $28.00 Next
Estimated Reading Time: 2 minutes
Don’t invest unless you’re prepared to lose all the money you invest. This is a high-risk investment and you are unlikely to be protected if something goes wrong. Take 2 minutes to learn more
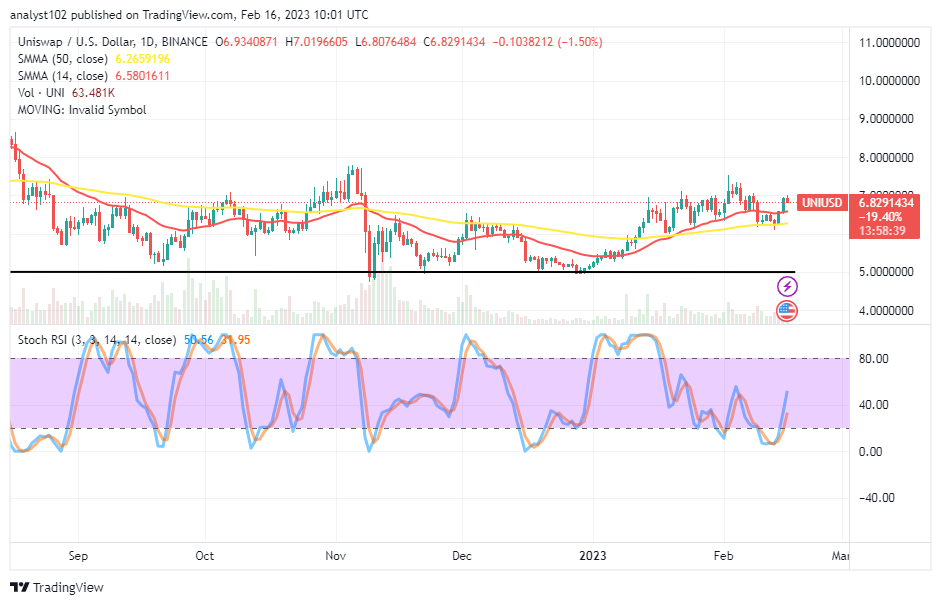
In recent weeks, Injective Protocol bulls have held strong against bearish pressure at the $24.00 price level. This led to a consolidation phase as bullish sentiment prevented the market from falling further into bearish territory. Despite the resilience of the bulls, the bears managed to push the price below this support level. However, this dip triggered buying activity as investors took advantage of the lower price, causing the price to rebound. Initially, the former support level turned into resistance, but the bullish momentum proved strong enough to break through this level, reclaiming it as support.
Injective Protocol Market Data
- INJ/USD Price Now: $25.5
- INJ/USD Market Cap: $2.4 billion
- INJ/USD Circulating Supply: 93 million INJ
- INJ/USD Total Supply: 100, million INJ
- INJ/USD CoinMarketCap Ranking: #50
Key Levels
- Resistance: $28.00, $28.70, and $30.00
- Support: $24.00, $23.00, and $22.00.
Injection Protocol Market Through the Lens of Indicators
The $24.00 price level has served as strong support for many days. The eventual breach of this level would typically trigger a surge in bearish sentiment in the Injective Protocol market. However, the swift response by bulls below the $24.00 price level indicates that they remain in control, despite indicators pointing to low market volatility and trading volume. Low volume does not necessarily indicate a lack of interest in the market; it could simply suggest a temporary recess in activity, with the potential for large orders to significantly move the price.
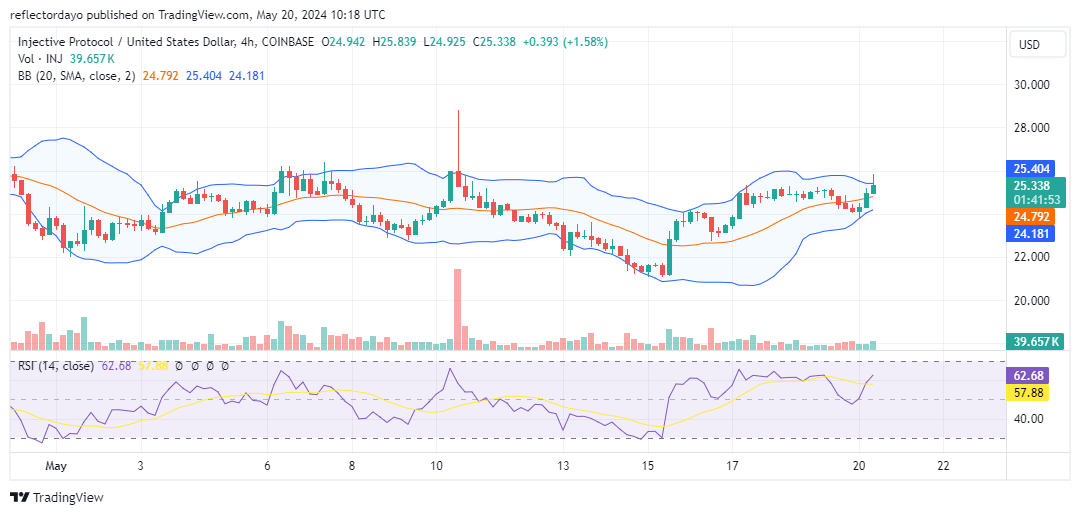
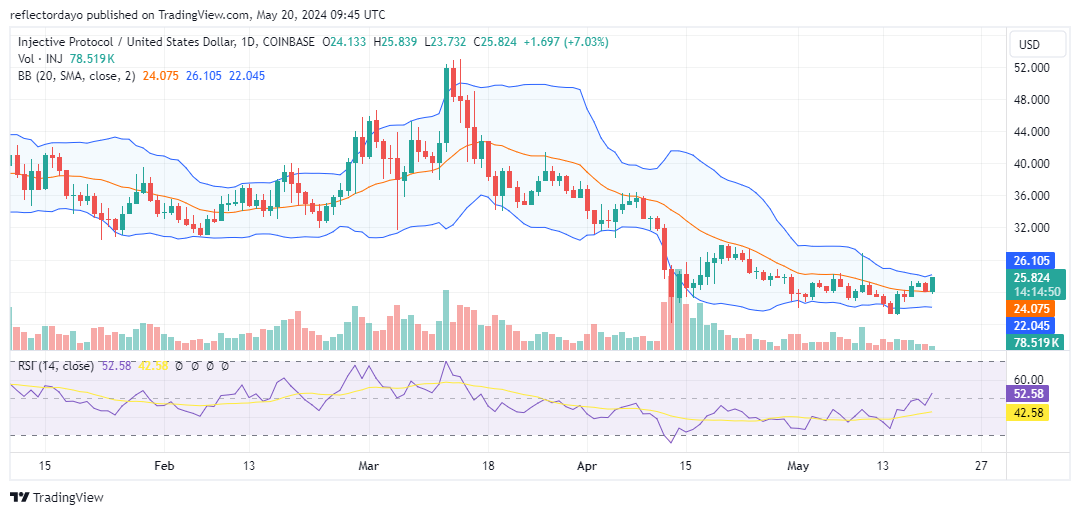
INJ/USD Price Prediction: 4-Hour Chart Analysis
The outlook of the 4-hour chart suggests an imminent breakout as the Bollinger Bands converge. Although the market is trending upward, the tightening of the bandwidth indicates a squeeze in volatility, which often precedes a significant breakout. This breakout could occur in either direction, despite the price action currently residing above the 20-day moving average. The price is surging towards the $25.00 level, and the upper shadows on the candlesticks suggest a potentially formidable resistance at this level.