Jasmy (JASMY/USD) Rebounds from Key Support, Eyes Breakout Confirmation
Estimated Reading Time: 3 minutes
Don’t invest unless you’re prepared to lose all the money you invest. This is a high-risk investment and you are unlikely to be protected if something goes wrong. Take 2 minutes to learn more
The Jasmy market (JASMY/USD) has reversed to the upside after reaching a major support level, with two strong bullish candlesticks signaling a potential shift in market direction. This development suggests the early stages of a bullish recovery.
However, for this momentum to be validated, the price must break through the resistance zone between $0.0145 and $0.0150. A decisive move above this range would confirm the strength and credibility of the ongoing bullish reversal.
The Jasmy Market Data
- JASMY/USD Price Now: $0.013
- JASMY/USD Market Cap: $633 million
- JASMY/USD Circulating Supply: 49 billion
- JASMY/USD Total Supply: 50 billion
- JASMY/USD CoinMarketCap Ranking: #86
Key Levels
- Resistance: $0.015, $0.016, and $0.017
- Support: $0.013, $0.012, and $0.011
Technical Outlook: Volume Activity Supports JASMY/USD Recovery, But Resistance Remains Key
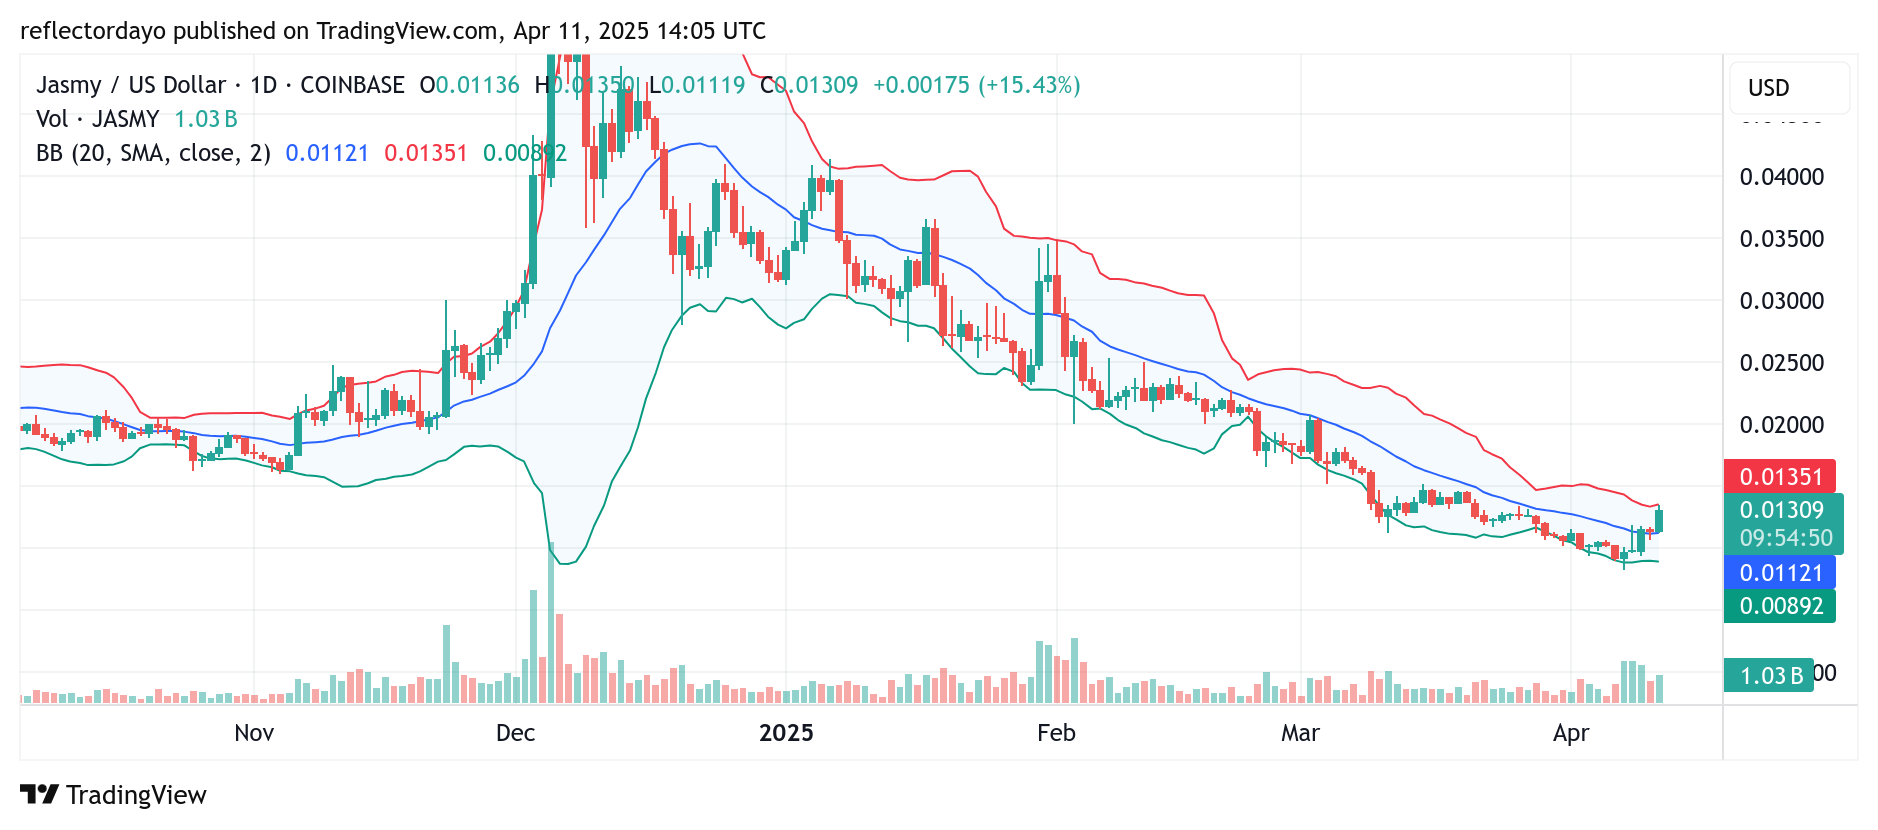
Following the bounce from the critical $0.0085 support level, trading volume spiked—reflecting a surge in investor interest. This renewed demand triggered a swift price rally, helping the market reclaim ground at the $0.010 level and push toward the crucial resistance zone.
Currently, the price is approaching a major resistance area between $0.0145 and $0.0150. A confirmed breakout above this range is essential to validate the bullish reversal.
Notably, volume histograms continue to reflect strong investor participation. However, as the price nears resistance, a slight dip in volume has been observed—suggesting some hesitation among traders as the crypto signal tests this critical barrier.
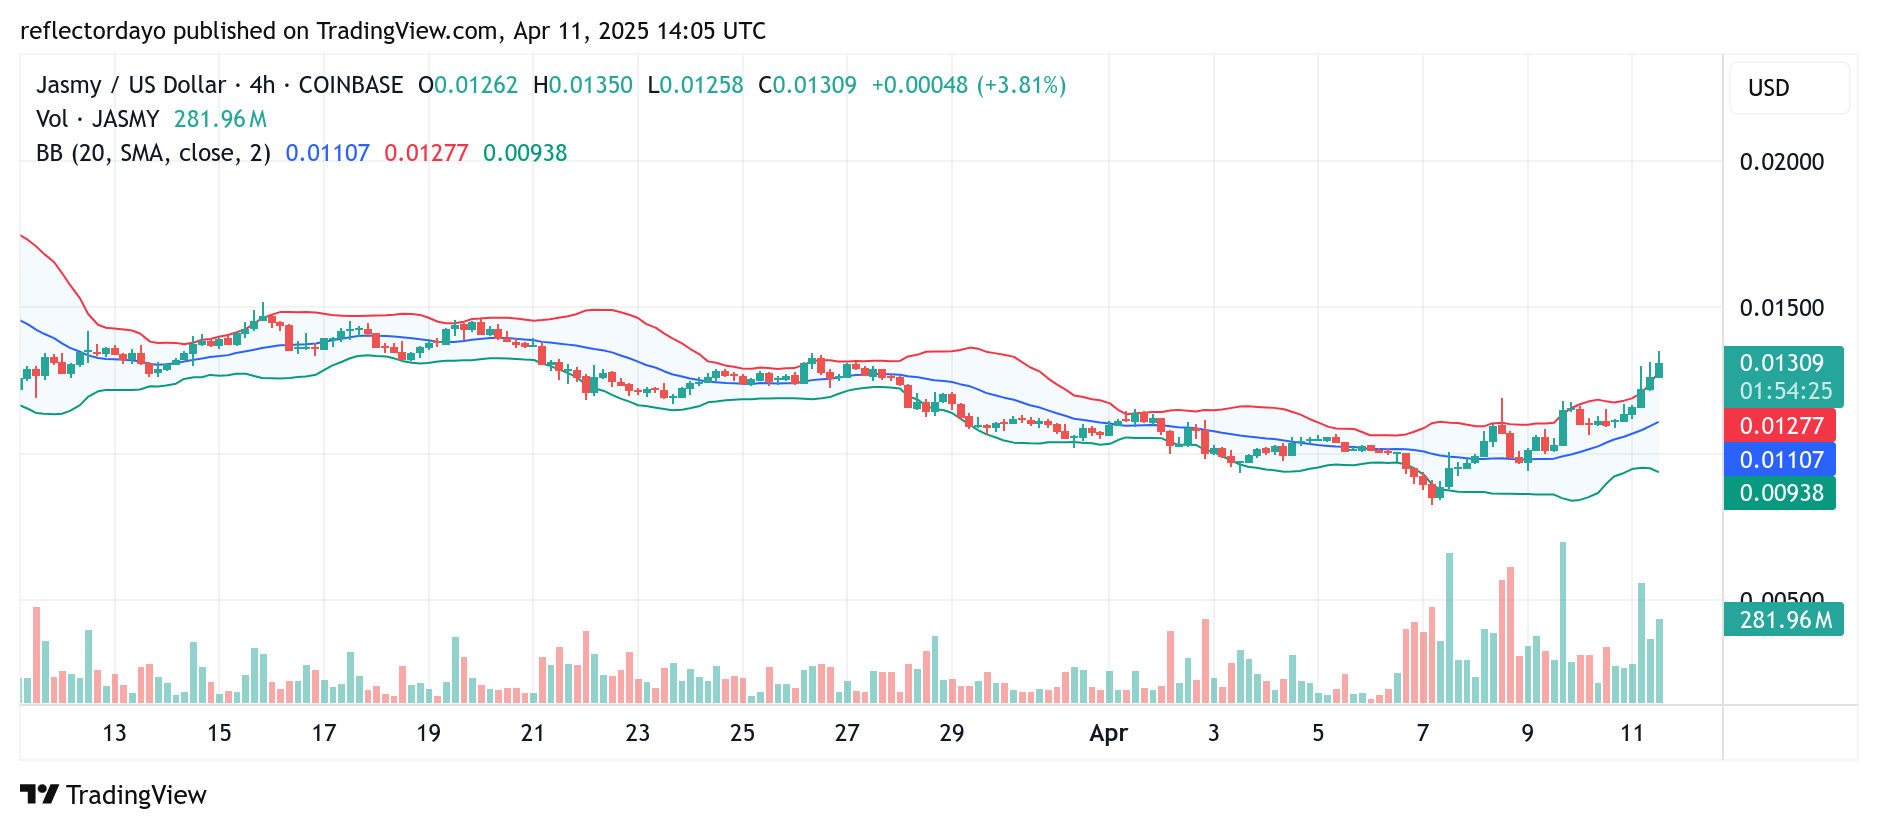
JASMY/USD Mid-Term Outlook (4-Hour Chart): Bullish Momentum Builds Despite Resistance Test
From a broader perspective, the Jasmy (JASMY/USD) market has remained in a sustained downtrend, characterized by a sequence of lower highs and lower lows—typical of a bearish phase. However, recent price action is beginning to suggest a potential shift in sentiment.
In recent sessions, a series of bullish candlesticks have emerged, signaling growing buyer interest. Yet, the resistance zone around $0.0145 remains significant. Candlesticks are developing noticeable upper wicks as they approach this level, indicating profit-taking by traders and hesitation near this barrier.
Despite this, trading volume remains strong—an encouraging sign that bullish sentiment is gaining ground. If the momentum holds and the $0.0145 resistance is breached decisively, it could confirm the beginning of a more sustained bullish reversal.