Jito (JTO/USD) Faces Headwinds Following Meteoric Rise
Estimated Reading Time: 3 minutes
Don’t invest unless you’re prepared to lose all the money you invest. This is a high-risk investment and you are unlikely to be protected if something goes wrong. Take 2 minutes to learn more

Following a rapid price surge on July 26th, Jito encountered resistance at the $3.00 level before experiencing a subsequent decline to $3.259. The market is currently consolidating as it absorbs the recent volatility.
Interestingly, the anticipated bearish correction following such a strong bullish run has been subdued. While the market has retraced somewhat, the bulls have managed to prevent a significant price decline below the critical $3.00 support level.
Jito Market Data
- JTO/USD Price Now: $3.18
- JTO/USD Market Cap: $392 million
- JTO/USD Circulating Supply: 123 million JTO
- JTO/USD Total Supply: 1 billion JTO
- JTO/USD CoinMarketCap Ranking: #144
Key Levels
- Resistance: $3.50, $4.00, and $4.50
- Support: $2.50, $2.00, and $1.50.
The Jito Market Through the Lens of Indicators
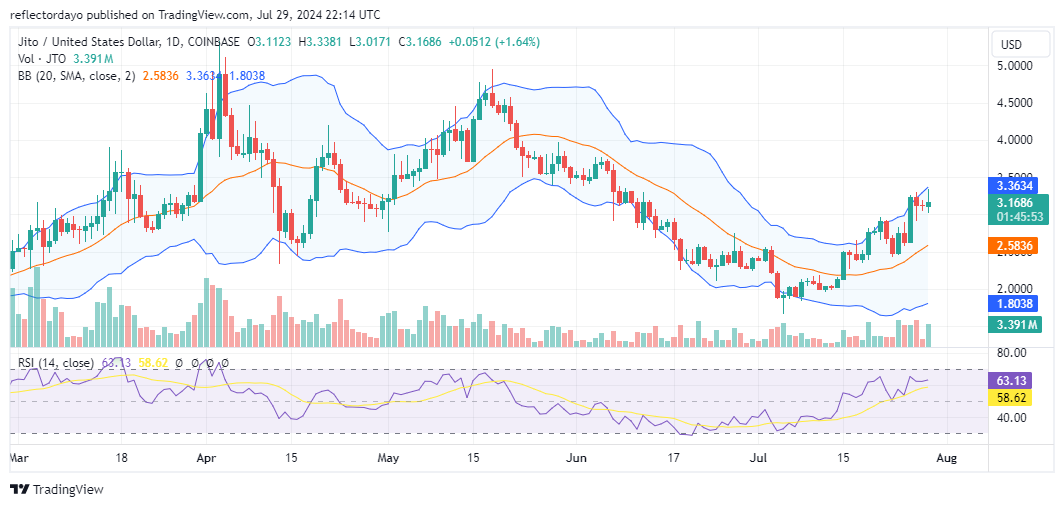
Following a bullish peak at $3.25 on July 26th, Jito experienced a sharp decline to the $3.00 level on the subsequent trading day. Bulls have since managed to defend this level, establishing it as a new support area. This consolidation phase has sparked debate among traders regarding the potential for a market reversal.
While some interpret the current consolidation as a precursor to a bearish trend, others remain optimistic about the continuation of the uptrend. JITO’s historical performance suggests a resilience to price corrections, often leading to renewed bullish momentum.
A decisive breakout above the $3.00 level could propel the price towards the previous high of $5.00. Conversely, a breakdown below this level may indicate a loss of bullish momentum and a potential shift in market sentiment.
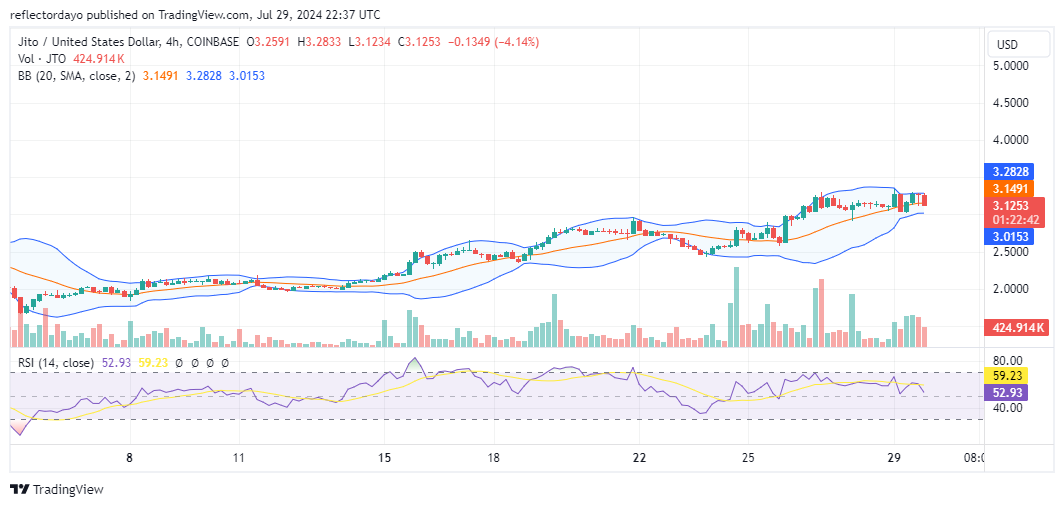
JTO/USD Price Prediction: 4-Hour Chart Analysis
The four-hour chart indicates a pronounced period of consolidation as buying and selling pressures remain evenly matched. Recent crypto signal have been characterized by indecisive price action, with a few doji candlesticks signaling a lack of directional clarity. While today’s trading has exhibited increased volatility, the market remains confined within a narrow range.
The contracting Bollinger Bands suggest that a significant price movement may be imminent. Traders should closely monitor price action and be prepared for a potential breakout above the $3.28 resistance level.