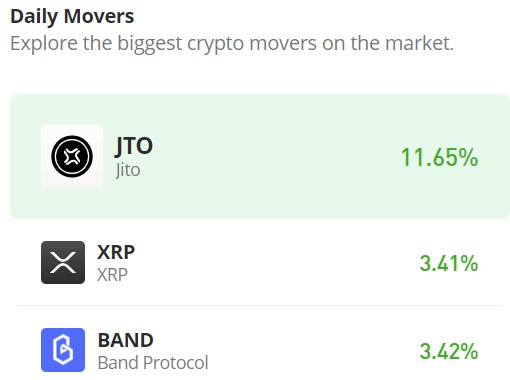
Jito (JTO/USD) Finds Footing at $2.50 – Can Bulls Push Higher?
Estimated Reading Time: 2 minutes
Don’t invest unless you’re prepared to lose all the money you invest. This is a high-risk investment and you are unlikely to be protected if something goes wrong. Take 2 minutes to learn more
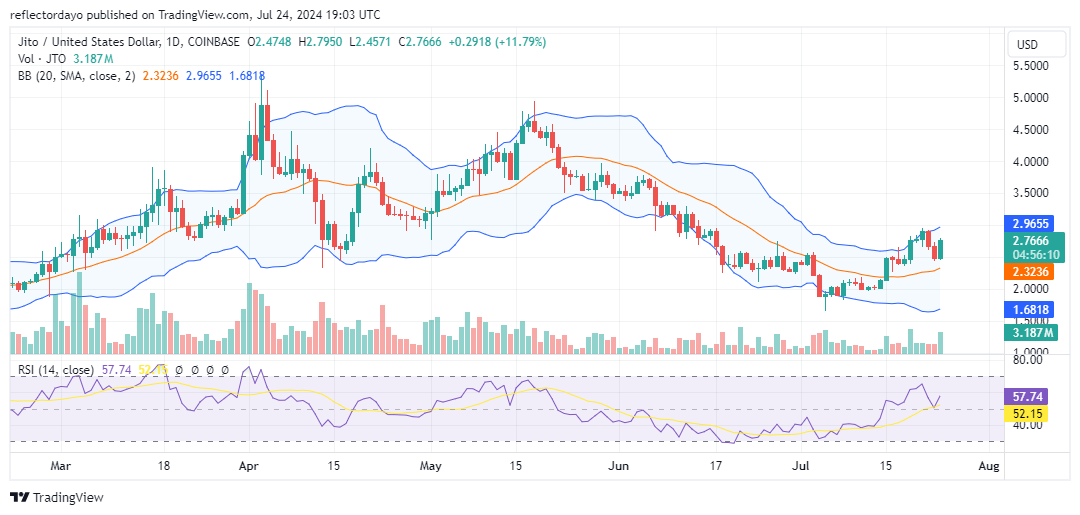
In previous months, the Jito market peaked at $5.00, followed by a prolonged bearish trend. In early July, a support level emerged at the $2.00 price point. Bullish intervention at this level was strong enough to initiate an upward price movement. After reaching a resistance level at $3.00, the price pulled back. However, indicating potential for further bullish action, bulls leveraged the $2.50 price level, which had been a resistance level in June. From here, the price rebounded.
Jito Market Data
- JTO/USD Price Now: $2.97
- JTO/USD Market Cap: $67 million
- JTO/USD Circulating Supply: 123 million JTO
- JTO/USD Total Supply: 1 billion JTO
- JTO/USD CoinMarketCap Ranking: #124
Key Levels
- Resistance: $3.00, $3.50, and $4.00
- Support: $2.50, $2.00, and $1.50.
The Jito Market Through the Lens of Indicators
From the $2.50 price level, the price action surged upwards towards $3.00. The last two daily trading sessions presented a bullish engulfing candlestick, indicating a Jito bullish signal. Additionally, the indicators retain a bullish bias: the Bollinger Bands show price action above the 20-day moving average, and the RSI indicates market momentum above the midpoint of the Relative Strength Index. However, despite these positive crypto signals, a small upper shadow on today’s candlestick suggests that some traders are taking profits at the $3.00 price level.
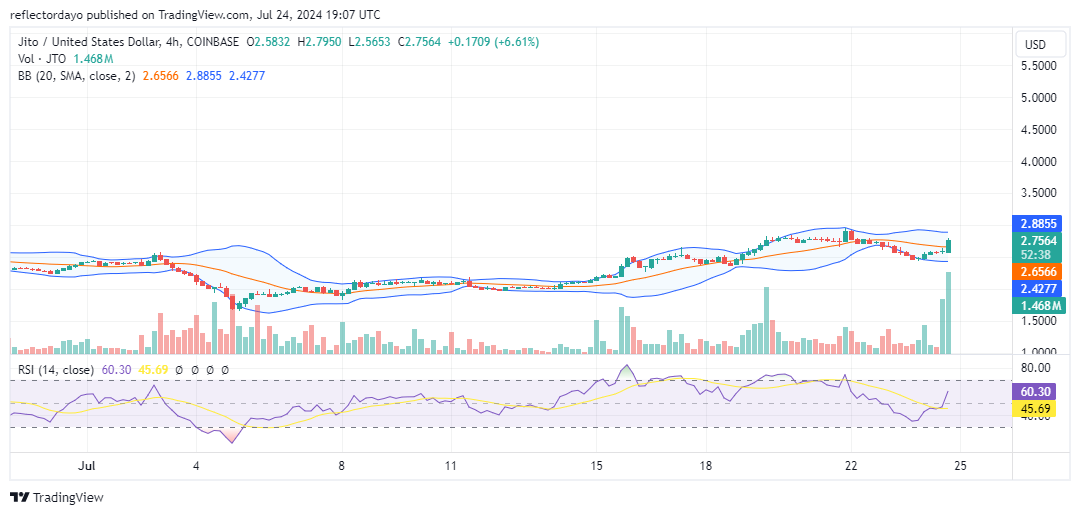
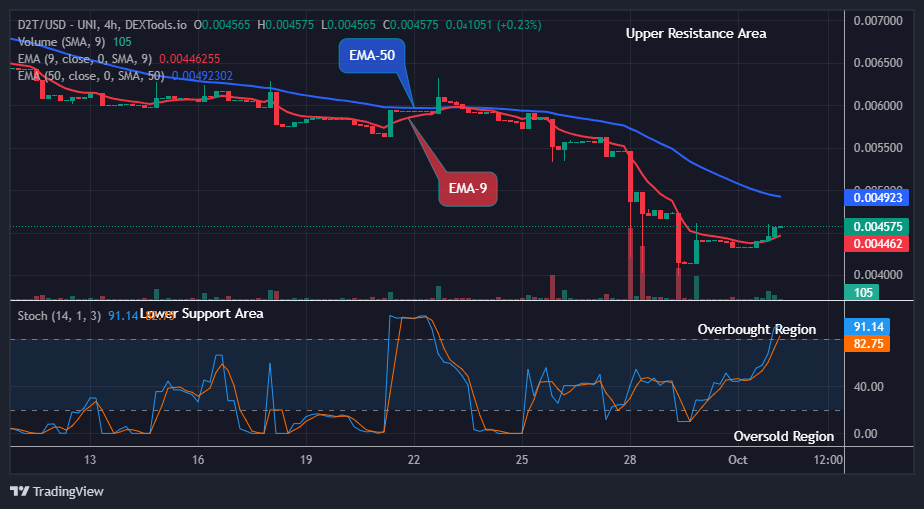
JTO/USD Price Prediction: 4-Hour Chart Analysis
On a smaller timeframe, the 4-hour chart suggests that the bullish rally may be slowing down as traders become indecisive with the market approaching the $3.00 price level. This is evident when comparing the candlestick of the ongoing trading session with the trading volume; the histogram is significantly stronger than the actual bullish candlestick. This indicates that while there is trading activity, traders are becoming more cautious as the price nears $3.00. Therefore, traders should anticipate a potential reversal at this level.