$SPONGE (SPONGE/USD) Testing the $0.00004 Price Level: Is a Breakout on the Horizon?
Estimated Reading Time: 3 minutes
Don’t invest unless you’re prepared to lose all the money you invest. This is a high-risk investment and you are unlikely to be protected if something goes wrong. Take 2 minutes to learn more

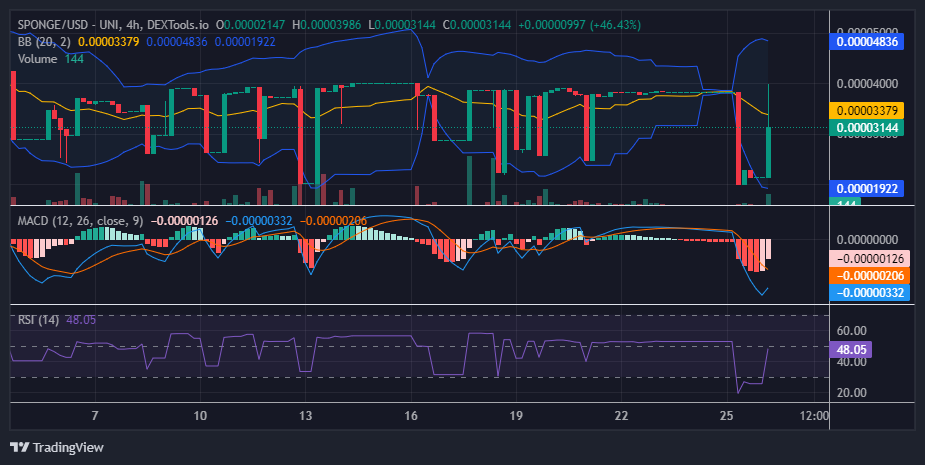
Based on previous analysis, we observed the market holding steady around the $0.000038 level, close to the critical $0.00004 price threshold. This period of consolidation and relatively flat price action persisted for some time. However, during the third 4-hour session yesterday, the $SPONGE market experienced a downward breakout, finding support around the $0.00002 level before bouncing back up. The significant drop from the $0.000038 level has increased market volatility, which could present challenges for the price action to stabilize and successfully break above the $0.00004 level.
Key Market Dynamics:
- Resistance Levels: $0.0010, $0.0011, $0.0012
- Support Levels: $0.000026, $0.000025, $0.000024
$SPONGE (SPONGE/USD) Technical Outlook
With the $SPONGE market experiencing high volatility, it may be difficult for the bulls to maintain a position above the $0.00004 level. This crypto signal likely explains why the price is merely testing this threshold. Bears have quickly taken advantage of the market volatility, establishing a strong selling pressure around the $0.00004 level. According to the volume of trade indicator, trading volume was previously low. However, as the price action now moves upward, the corresponding histogram for the current trading session is also increasing. This suggests that buyers are re-entering the market, and while the price is trending upward, it may encounter resistance at the $0.00004 level.
$SPONGE (SPONGE/USD) 1-Hour Chart Insights
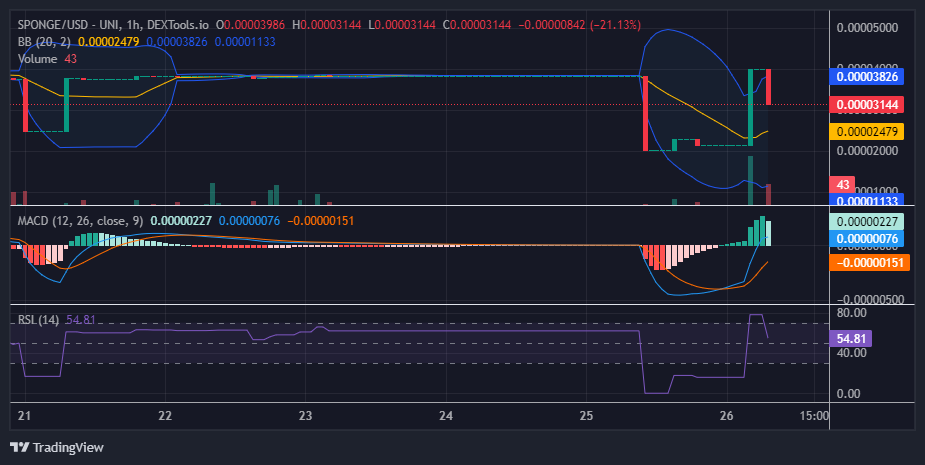
Zooming into a smaller timeframe, specifically the 1-hour chart, we observed that after a significant drop, which pushed the market below the 30 level into the oversold region, there was a sharp recovery that led the price to a resistance point around $0.00004. The price action remained relatively flat at this level for approximately two sessions before another breakdown occurred. Currently, the price appears to have stabilized around the $0.000031 level. This could indicate a potential starting point for a market rebound from this level.
Buy SPONGE/USD!
Perfection 💦💦💦 pic.twitter.com/dWoFITGBKx
— $SPONGE (@spongeoneth) August 25, 2024
Join the SPONGE community and be part of the next big crypto sensation! Buy Sponge ($SPONGE) today!