$SPONGE (SPONGE/USD): Stuck at $0.000038 – Will it Break Out?
Estimated Reading Time: 2 minutes
Don’t invest unless you’re prepared to lose all the money you invest. This is a high-risk investment and you are unlikely to be protected if something goes wrong. Take 2 minutes to learn more

As previously analyzed, the SPONGE/USD market has been in a state of consolidation near the $0.000038 price level. This level is adjacent to the significant $0.00004 resistance, a historical battleground for bulls and bears. Despite repeated attempts by bulls to push the price higher, bears have consistently defended this resistance.
However, recent technical indicators suggest that a significant market movement may be imminent. Let’s examine the crpto signal and supporting data to assess the potential for a breakout.
Key Market Dynamics:
- Resistance Levels: $0.0010, $0.0011, $0.0012
- Support Levels: $0.000026, $0.000025, $0.000024
$SPONGE (SPONGE/USD) Technical Outlook
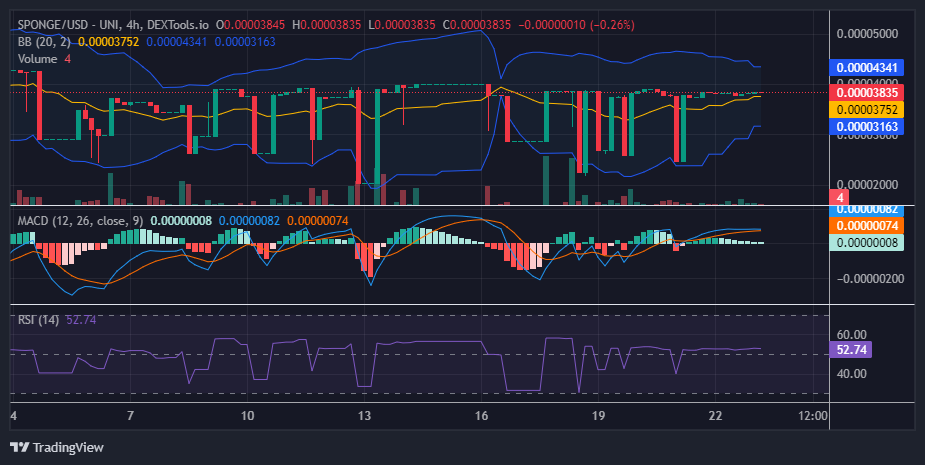
Despite recent price stagnation at $0.000038, technical indicators suggest a potential breakout in the market. While the price has remained relatively flat, the Bollinger Bands are exhibiting a pattern that could signal an impending move. The lower band is converging upwards towards the stable upper band, indicating decreasing volatility and potential tension that could lead to a breakout.
This consolidation phase might be attributed to accumulation by investors, setting the stage for a more significant price movement. Traders should remain vigilant for potential opportunities as the market approaches a potential breakout.
$SPONGE 1-Hour Chart Insights
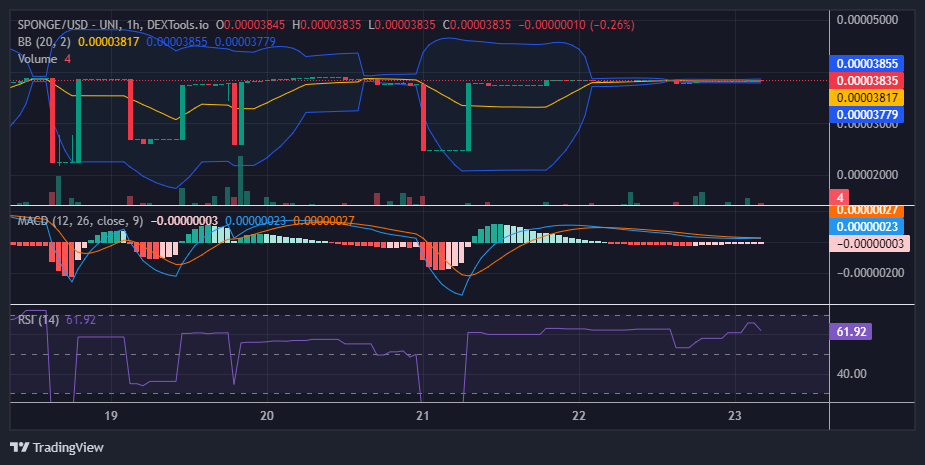
The one-hour chart displays a market in a state of equilibrium, with price action confined to a narrow range around $0.000038. This extreme price stability has persisted since August 21. The convergence of Bollinger Bands, a technical indicator, often signals an impending breakout, suggesting that a significant price movement may be imminent.
Buy SPONGE/USD!
When your #MemeCoin bags start pumping 🚀 pic.twitter.com/tMS67PmArb
— $SPONGE (@spongeoneth) August 21, 2024
Join the SPONGE community and be part of the next big crypto sensation! Buy Sponge ($SPONGE) today!