Litecoin (LTC/USD) Bulls Poised to Reclaim the $120 Level
Estimated Reading Time: 3 minutes
Don’t invest unless you’re prepared to lose all the money you invest. This is a high-risk investment and you are unlikely to be protected if something goes wrong. Take 2 minutes to learn more

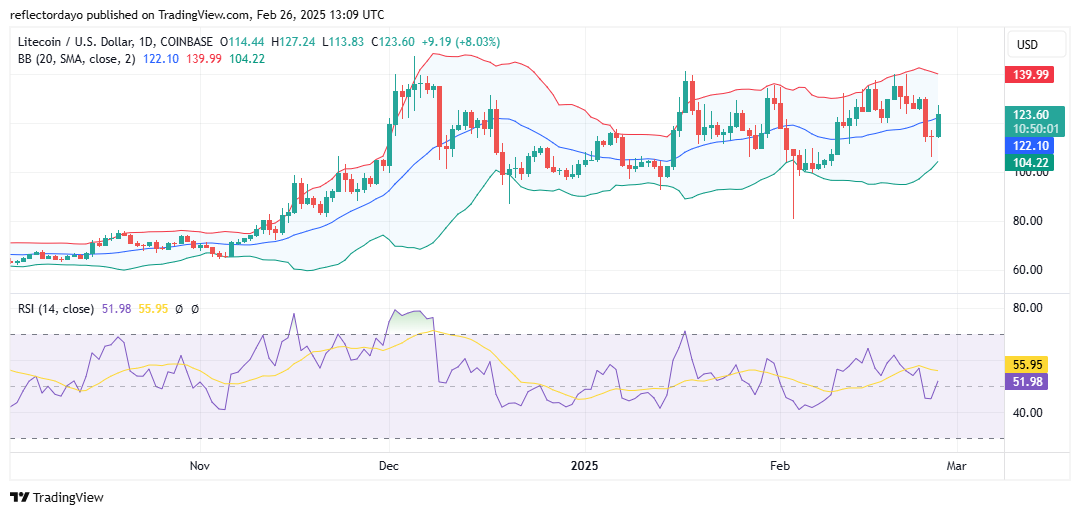
The $120 price level has been a critical point in the Litecoin market since early December of last year. Initially, it served as a higher support level following a significant price surge. The bullish rally peaked around $140, and as profit-taking set in, the $120 level emerged as a key support, reflecting traders’ confidence in the market’s potential for further upside. This sustained support may explain why the price level has remained intact since then.
Litecoin Market Data
- LTC/USD Price Now: $123.4
- LTC/USD Market Cap: $9.3 billion
- LTC/USD Circulating Supply: 75.6 million LTC
- LTC/USD Total Supply: 84 million LTC
- LTC/USD CoinMarketCap Ranking: #12
Key Levels
- Resistance: $130, $140, and $150
- Support: $114, $100, and $80.
The Litecoin Market Through the Lens of Indicators
In early December, when the $120 support level first emerged, the Litecoin market speculation was high, leading to increased volatility. As a result, the bulls struggled to sustain support at this level, causing the price to fluctuate around it and solidifying its importance as a key price level.
Between mid-December and mid-January, Litecoin traded below $120. However, as market sentiment shifted in favor of optimistic traders in the latter half of January, the price surged above $120. Despite this breakout, bears at $140 remained strong and continued to exert influence around the $120 level.
Recently, the market established a higher support level at $114, which has facilitated a move above $120. This development in the crypto signal is causing the Bollinger Bands to converge, indicating a reduction in market volatility. If the bulls can maintain their position at $114, they may sustain a rally toward $140. However, bearish pressure remains active, as evidenced by the upper shadow on today’s candlestick, signaling continued selling interest at higher levels.
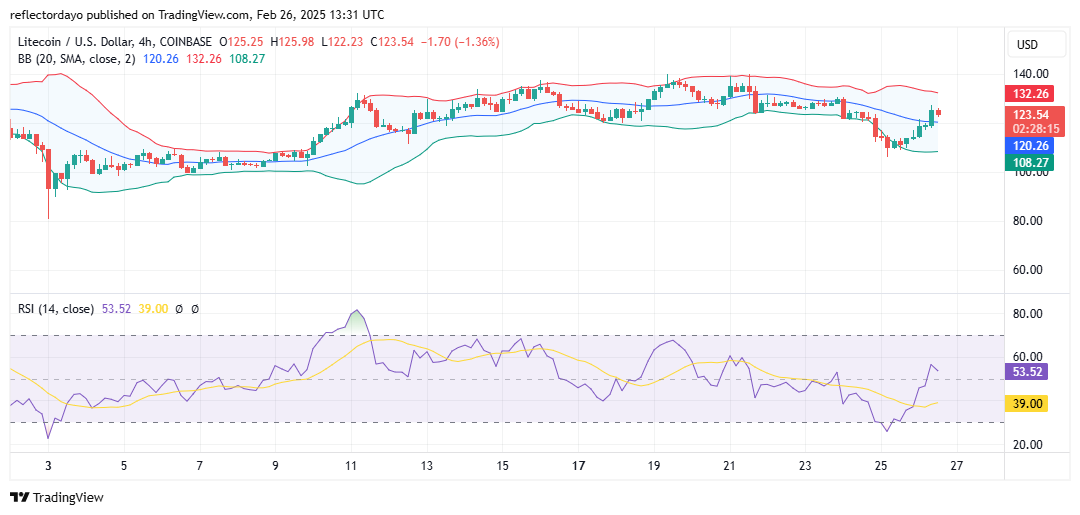
LTC/USD Price Prediction: 4-Hour Chart Analysis
Examining the market from a smaller timeframe, such as the 4-hour chart, and analyzing its price behavior, one might infer that the $120 support level could hold, providing bulls with the momentum to push the market further in their favor.
Observing the last four candlesticks, the initial reaction at $120 showed some resistance. However, a strong bullish candlestick signaled a breakout above this level, driving the price to $127. This was followed by a small bearish candlestick, indicating a minor reversal—likely due to some traders taking profits at the recent high.
If this correction continues, $120 could be confirmed as a support level, reinforcing the market’s recovery and potentially sustaining further upward momentum.