Near Protocol (NEAR/USD) Finds Bullish Strength at $2.6
Estimated Reading Time: 3 minutes
Don’t invest unless you’re prepared to lose all the money you invest. This is a high-risk investment and you are unlikely to be protected if something goes wrong. Take 2 minutes to learn more

The Near Protocol market recently experienced heightened volatility, with price action favoring the upside. Bulls pushed the market as high as the $3.3 resistance level, where profit-taking set in and triggered a pullback.
Bears attempted to capitalize on this retracement; however, their momentum stalled at the $2.6 support zone, where strong buying interest emerged. This reinforces $2.6 as a key demand area, highlighting the resilience of bullish sentiment in the market.
Near Protocol (NEAR/USD) Market Data
- NEAR/USD Price Now: $2.87
- NEAR/USD Market Cap: $3.57 billion
- NEAR/USD Circulating Supply: 1.24 billion
- NEAR/USD Total Supply: 1.27 billion
- NEAR/USD CoinMarketCap Ranking: #35
Key Levels to Watch
- Resistance: $3.00, $3.50, $4.00
- Support: $2.60, $2.40, $2.20
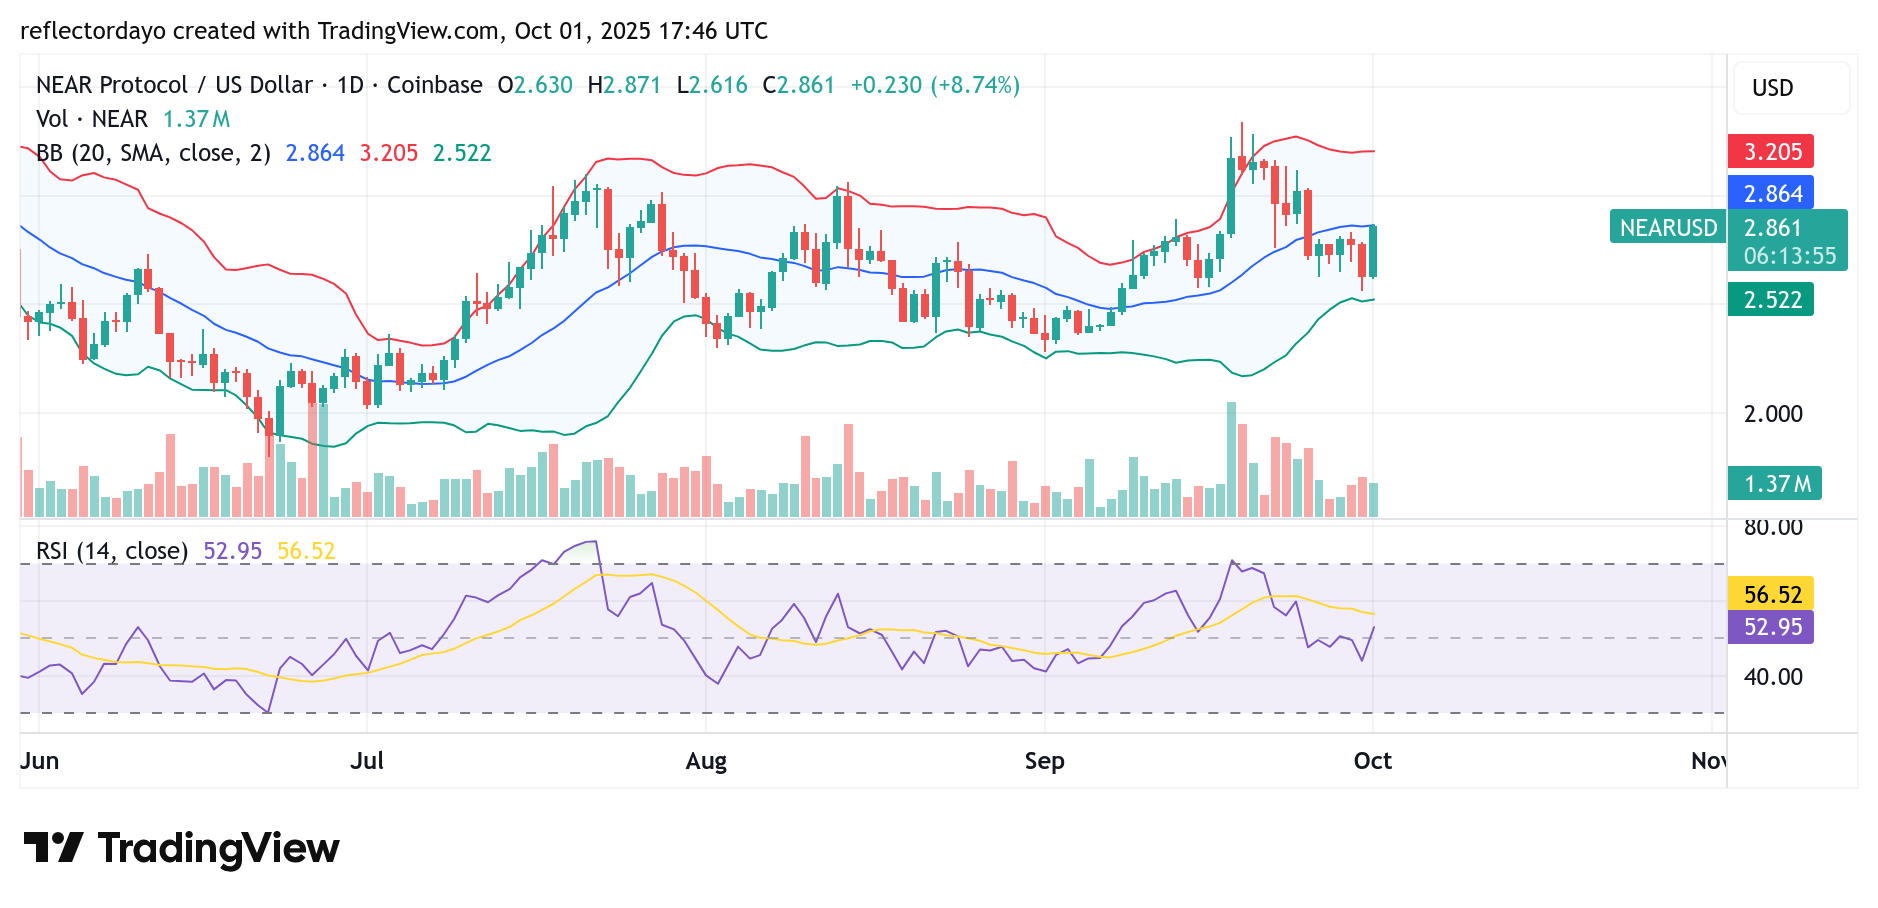
Near Protocol (NEAR/USD) Daily Chart Outlook
Bulls have firmly established support at the $2.6 level, setting the tone for the first trading day of October. The market opened at $2.6 and has since advanced to $2.8, forming a Marubozu candlestick—a pattern characterized by the absence of both upper and lower shadows, signaling clear bullish dominance.
Interestingly, the current price action aligns closely with the 20-day moving average, placing the Near Protocol market at a critical midpoint. Should the bullish momentum persist, the market could build on this breakout. However, if buying pressure weakens, price may enter a consolidation phase, with the Bollinger Bands tightening to form a horizontal trading channel.
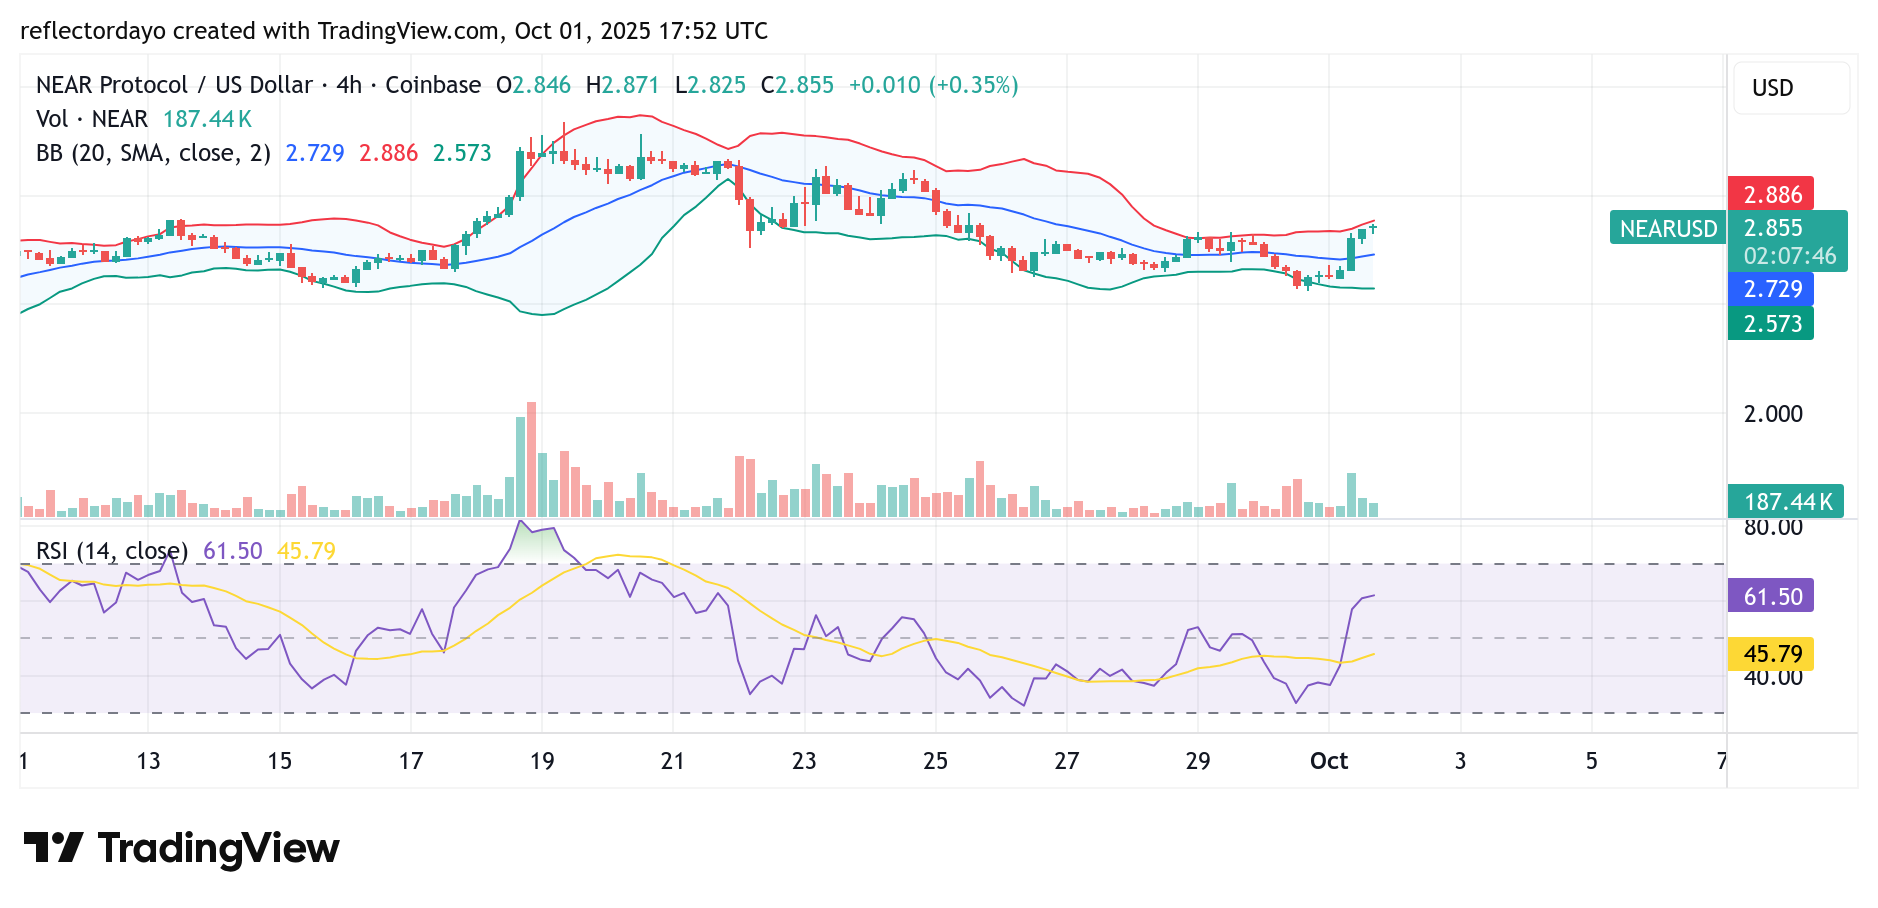
NEAR/USD 4-Hour Chart Outlook
As the market approaches the $2.8 zone, candlesticks are showing signs of reduced volume, suggesting that bulls are becoming more cautious at this level. Historical price behavior further supports this outlook, as prior sessions have recorded bearish rejections around the same area. This indicates the presence of notable selling pressure, which could intensify as the price nears the $3.0 resistance level.
For now, a degree of resistance is evident at $2.8, and if bullish momentum continues to ease, the market may enter a consolidation phase around this zone. However, sustained buying pressure could help price action stabilize before attempting another breakout.