Ondo Finance (ONDO/USD) Eyes Key Support Zone at $1.40–$1.50
Estimated Reading Time: 3 minutes
Don’t invest unless you’re prepared to lose all the money you invest. This is a high-risk investment and you are unlikely to be protected if something goes wrong. Take 2 minutes to learn more
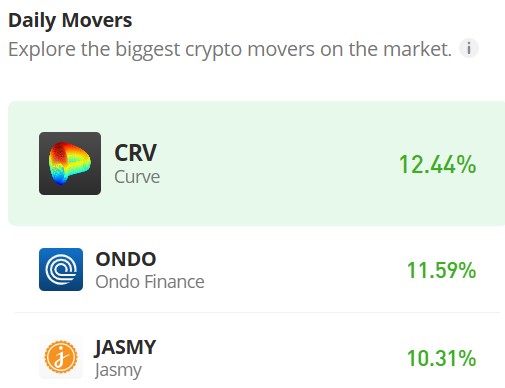
Ondo Finance (ONDO/USD) experienced a strong bullish rally in December, reaching its peak near $1.96 on December 4th. Following this high, the market entered a corrective phase, with prices trending downward. A potential support zone appears to be forming between the $1.40 and $1.50 levels, as bearish momentum has been rejected around this area. Despite this, the market retains a bullish bias overall. However, due to prevailing volatility, price fluctuations may remain erratic, with the possibility of a temporary dip below the identified support zone.
The Ondo Finance Market Data
- ONDO/USD Price Now: $1.60
- ONDO/USD Market Cap: $2.2 billion
- ONDO/USD Circulating Supply: 1.38 billion
- ONDO/USD Total Supply: 10 billion ONDO
- ONDO/USD CoinMarketCap Ranking: #62
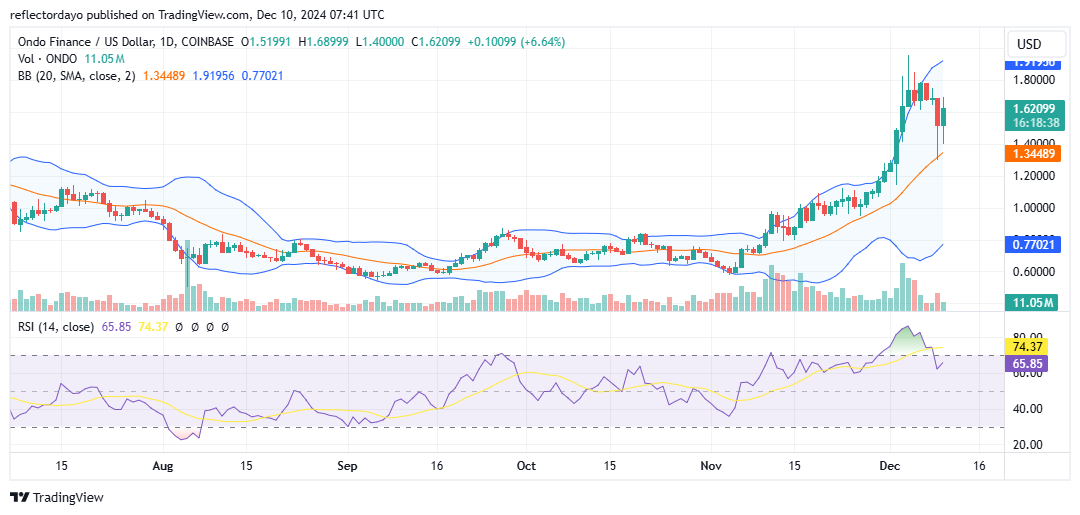
Key Levels
- Resistance: $1.80, $1.85, and $1.90
- Support: $1.60, $1.50, and $1.40.
The Ondo Finance Market Through the Lens of Indicators
The bullish bias in the Ondo Finance market remains strong, as evidenced by the price bouncing at a higher level between yesterday and today. This suggests the potential for the uptrend to continue. As the crypto signal rallies, the $1.80 and $2.00 price levels may act as resistance zones.
Despite the upward movement, the bullish price action continues to face notable bearish pressure, indicating a tug-of-war between buyers and sellers. Today’s daily candlestick is bullish; however, the prominent upper and lower shadows reflect a balance between demand and supply. This equilibrium could lead to consolidation, another bounce, or even a breakdown. For now, demand and supply forces appear evenly matched.
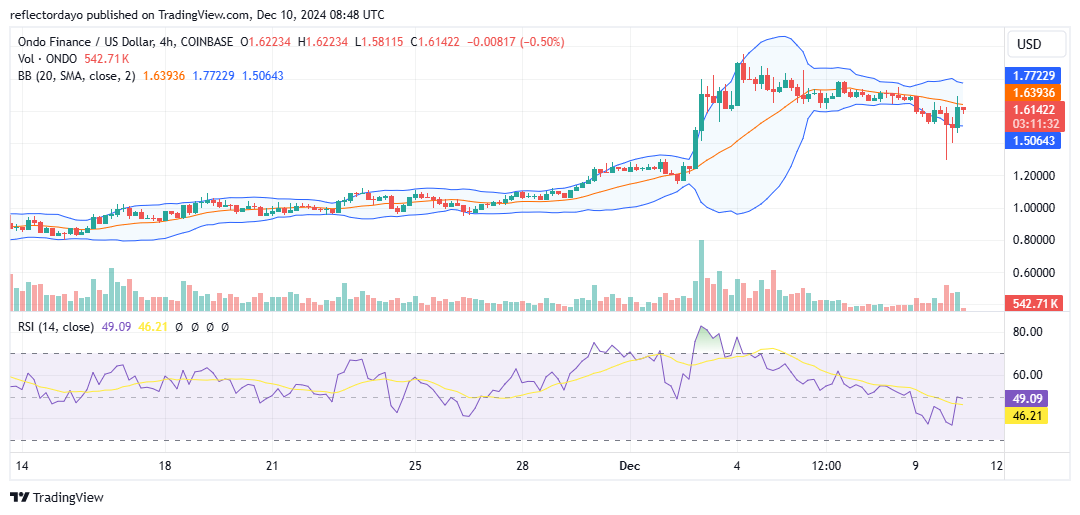
ONDO/USD Price Prediction: 4-Hour Chart Analysis
Recently, the market has exhibited downward volatility, but the price has managed to recover above the $1.60 level, where the bulls are making a strong effort to maintain support. Optimistic traders have shown resilience in pushing the market upward. However, the 20-day moving average indicates a slight downward trend, raising uncertainty about whether the bulls can withstand the advancing bearish pressure.
When the price briefly dipped below $1.60, bullish momentum quickly rejected the bearish move, signaling that this level could serve as a critical support zone. Traders should closely monitor this area for signs of either a breakout or a breakdown, as the market remains at a pivotal point.