Orca (ORCA/USD) Market Outlook: Bullish Momentum Signals Potential Trend Shift
Estimated Reading Time: 3 minutes
Don’t invest unless you’re prepared to lose all the money you invest. This is a high-risk investment and you are unlikely to be protected if something goes wrong. Take 2 minutes to learn more
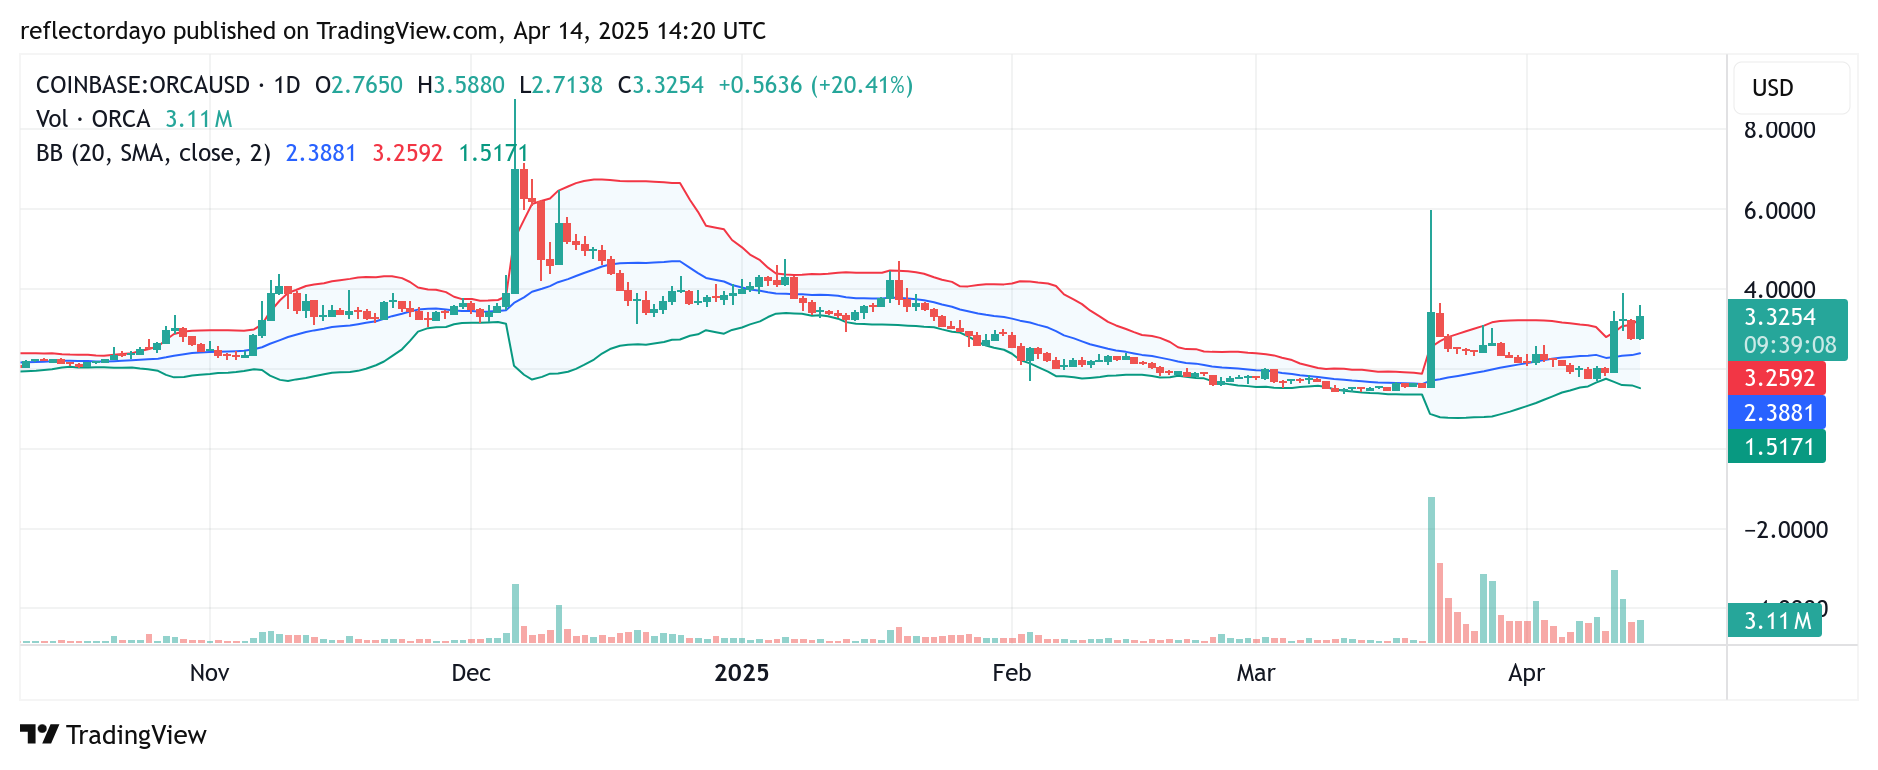
The recent bear run in the Orca (ORCA/USD) market appeared to lose steam around the $1.30 level on March 10, where a consolidation phase began to take shape. This period of price stabilization lasted until approximately March 21, when a sudden influx of bullish liquidity sparked a sharp upward movement.
The market surged dramatically from the $1.30 range to a local high near the $6.00 mark—an impressive rally driven by renewed buying interest. While such a rapid bullish breakout often leads to a corrective pullback due to heightened volatility, the significant upside move has likely helped bulls establish a stronger support base. This could provide the momentum needed to sustain a longer-term bullish trend.
The Orca Market Data
ORCA/USD Price Now: $3.27
ORCA/USD Market Cap: $181 million
ORCA/USD Circulating Supply: 55.7 million
ORCA/USD Total Supply: 99.99 million
ORCA/USD CoinMarketCap Ranking: #181 million
Key Levels
- Resistance: $2.00, $2.20, and $3.00
- Support: $1.30, $1.20, and $1.10
Technical Outlook on the Orca (ORCA/USD) Market: Bullish Momentum Builds as Resistance Comes Under Pressure
Following the bounce from the $1.30 support level, the ORCA/USD market has recorded a series of ascending lows—an encouraging sign of bullish progression and upward momentum. These higher lows indicate that buyers are gradually gaining ground and pushing the market forward.
However, resistance around the $3.40 level remains firm, with sellers maintaining a stronghold at this critical price point. Despite the pressure from buyers, the bears appear persistent in defending this level. That said, the continued formation of higher lows suggests mounting pressure on the resistance zone, as support steadily approaches.
One key challenge is the current market volatility in the crypto signal, which may make breaching the $3.40 resistance more difficult. Still, sustained bullish momentum could eventually force a breakout if the upward trend persists.
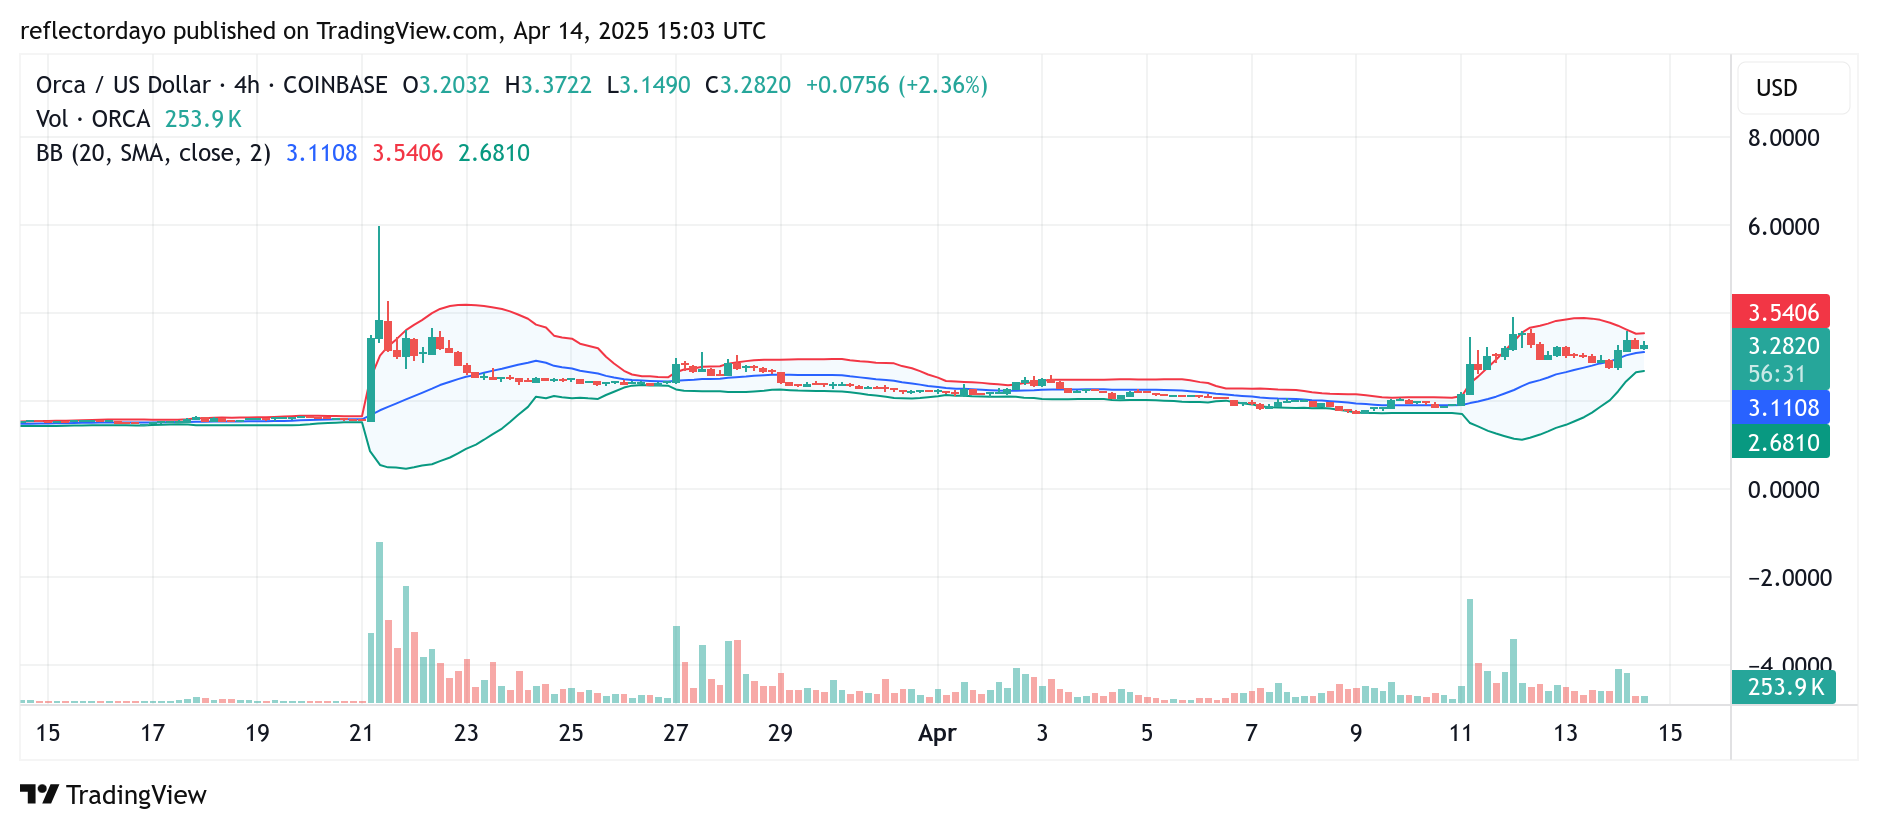
ORCA/USD 4-Hour Chart Analysis: Volatility Squeeze Signals Imminent Breakout
A closer look at the ORCA/USD market through the lens of the 4-hour chart reveals signs of an impending sharp price movement. This expectation is supported by the noticeable convergence of the Bollinger Bands near the critical $3.40 resistance level—a common technical indication of reduced volatility and a potential breakout setup.
Further reinforcing this outlook is the declining trading volume, as shown by the histogram bars, which suggests a temporary standoff between buying and selling pressure. This type of market compression, often referred to as a “volatility squeeze,” tends to precede significant price action.
Given the presence of ascending lows in recent sessions, the probability of an upward breakout appears increasingly favorable. If bulls can sustain pressure, a decisive move above the $3.40 resistance could mark the beginning of a new bullish phase.