Origin Protocol (OGN/USD) Fails to Break Through the Bearish Barrier at $0.100
Estimated Reading Time: 2 minutes
Don’t invest unless you’re prepared to lose all the money you invest. This is a high-risk investment and you are unlikely to be protected if something goes wrong. Take 2 minutes to learn more
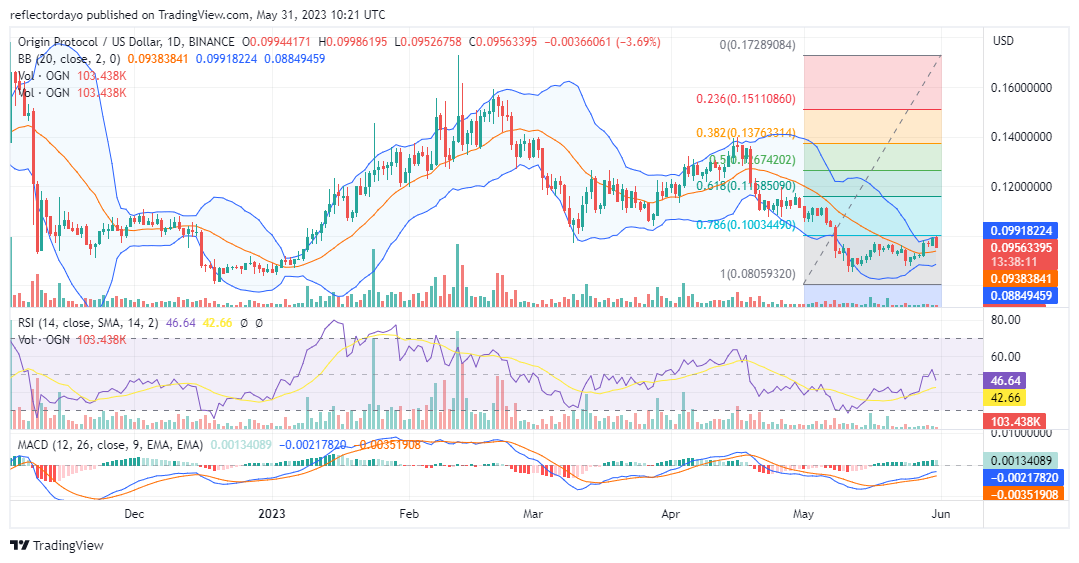
The Origin protocol market is in a downtrend, which started in mid-April and has continued until May 11. The bearish trend, however, hit a brick wall around the $0.0864 price level. The selling pressure pushed the price far enough into the demand zone to reach a level where traders are willing to buy again.
OGN Market Data
- OGN/USD Price Now: $0.096
- OGN/USD Market Cap: $48,717,495
- OGN/USD Circulating Supply: 509,224,250 OGN
- OGN/USD Total Supply: 1,000,000,000
- OGN/USD Coinmarketcap Ranking: #380
Key Levels
- Resistance: $0.10, $0.11, and $0.12.
- Support: $0.08, $0.07, and $0.06.
Price Prediction for Origin Protocol: The Indicators’ Point of View
Although bears could not push the market beyond the $0.0864 support level, bulls also appeared weak to propel the price beyond the $0.10 price mark. The bullish recovery failure may be due to a low amount of trade volume. The Origin Protocol market is already set for upside action because, according to the Fibonacci retracement indicator, the market has completed a full cycle, as the $0.088 price level represents the 100% Fibonacci retracement level. So despite today’s price pullback, the market is set for upside action.
OGN/USD 4-Hour Chart Outlook:
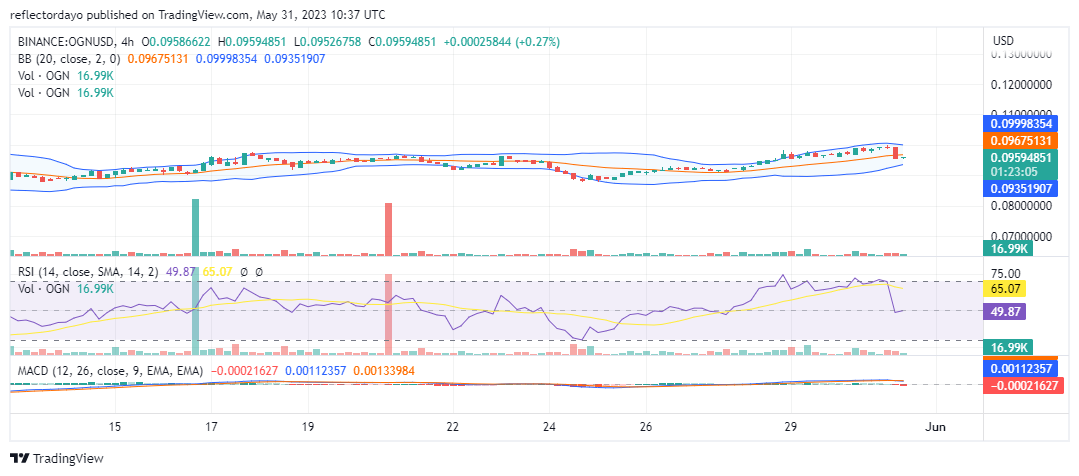
Even from a 4-hour timeframe perspective, the volume of trade is also on the low side. That explains the reason for the very significant price retracement. The second 4-hour session was completely bearish. However, a support level is forming around the level of the 20-day moving average as the Bollinger Bands indicator continues to portray an upward-moving price channel.