Pepe Unchained (PEPU/USD) Edges Higher Amid Ongoing Consolidation
Estimated Reading Time: 3 minutes
Don’t invest unless you’re prepared to lose all the money you invest. This is a high-risk investment and you are unlikely to be protected if something goes wrong. Take 2 minutes to learn more

The recent analysis of the Pepe Unchained (PEPU/USD) market highlighted a period of consolidation around the $0.000125 level, with early signs of a potential recovery. In the latest price movement, the market has made a marginal advance, climbing to the $0.00013 zone—an encouraging development that hints at continued bullish momentum.
As the trading session progresses, this subtle upward shift warrants a closer look through the lens of technical indicators. By evaluating current market signals, we can better assess the strength and sustainability of this early-stage recovery and determine whether PEPU/USD is poised for a more decisive breakout.
Key Levels to Watch
- Resistance: $0.007, $0.008, $0.009
- Support: $0.0012, $0.0011, $0.0010
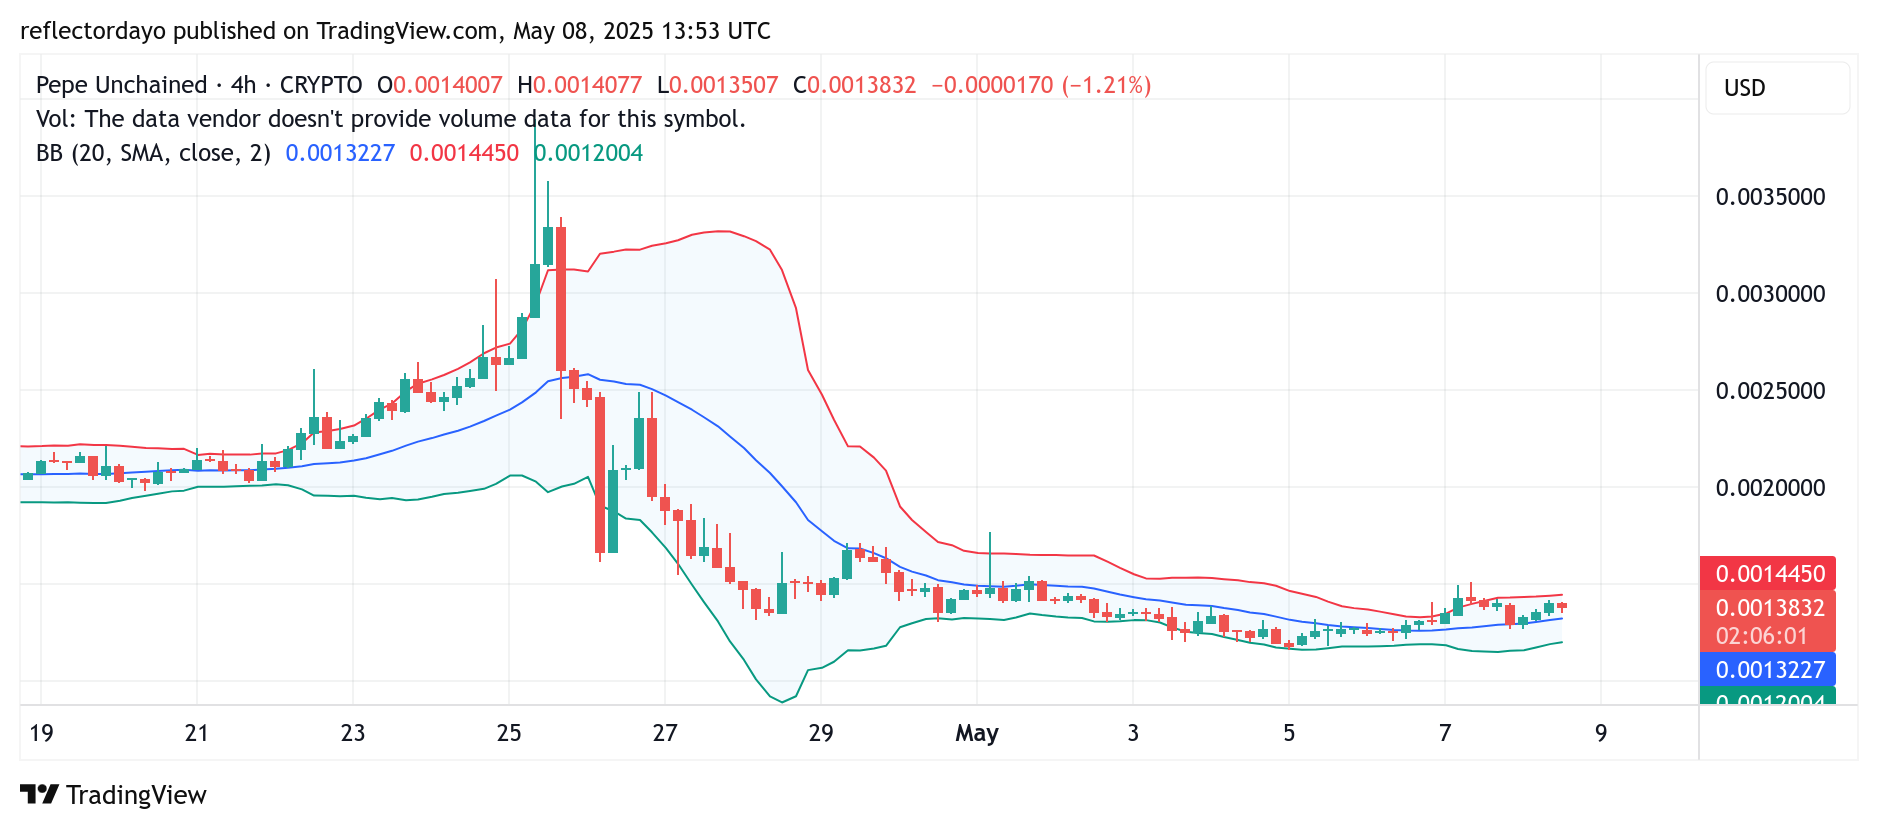
Pepe Unchained (PEPU/USD) 4-Hour Chart: Momentum Builds Amid Low Volume
Price action on the 4-hour chart shows PEPU/USD trading above the 20-day moving average—a positive sign for bullish sentiment. However, trading volume remains relatively low, indicating that traders are not yet fully convinced of the strength behind the emerging uptrend.
The Bollinger Bands also reflect this cautious environment, with a narrow bandwidth that signals both low volatility and limited trading activity. This crypto signal suggests that the market is in a wait-and-see mode, even as it leans bullish.
Interestingly, a lower resistance level has quickly formed at $0.00014 following a recent price rejection at that level—just below the broader resistance at $0.00015. Despite this setback, the appearance of a lower shadow beneath the current candlestick indicates that buyers remain active and are still holding long positions. This continued buying interest keeps the possibility of a breakout above $0.00015 very much in play.
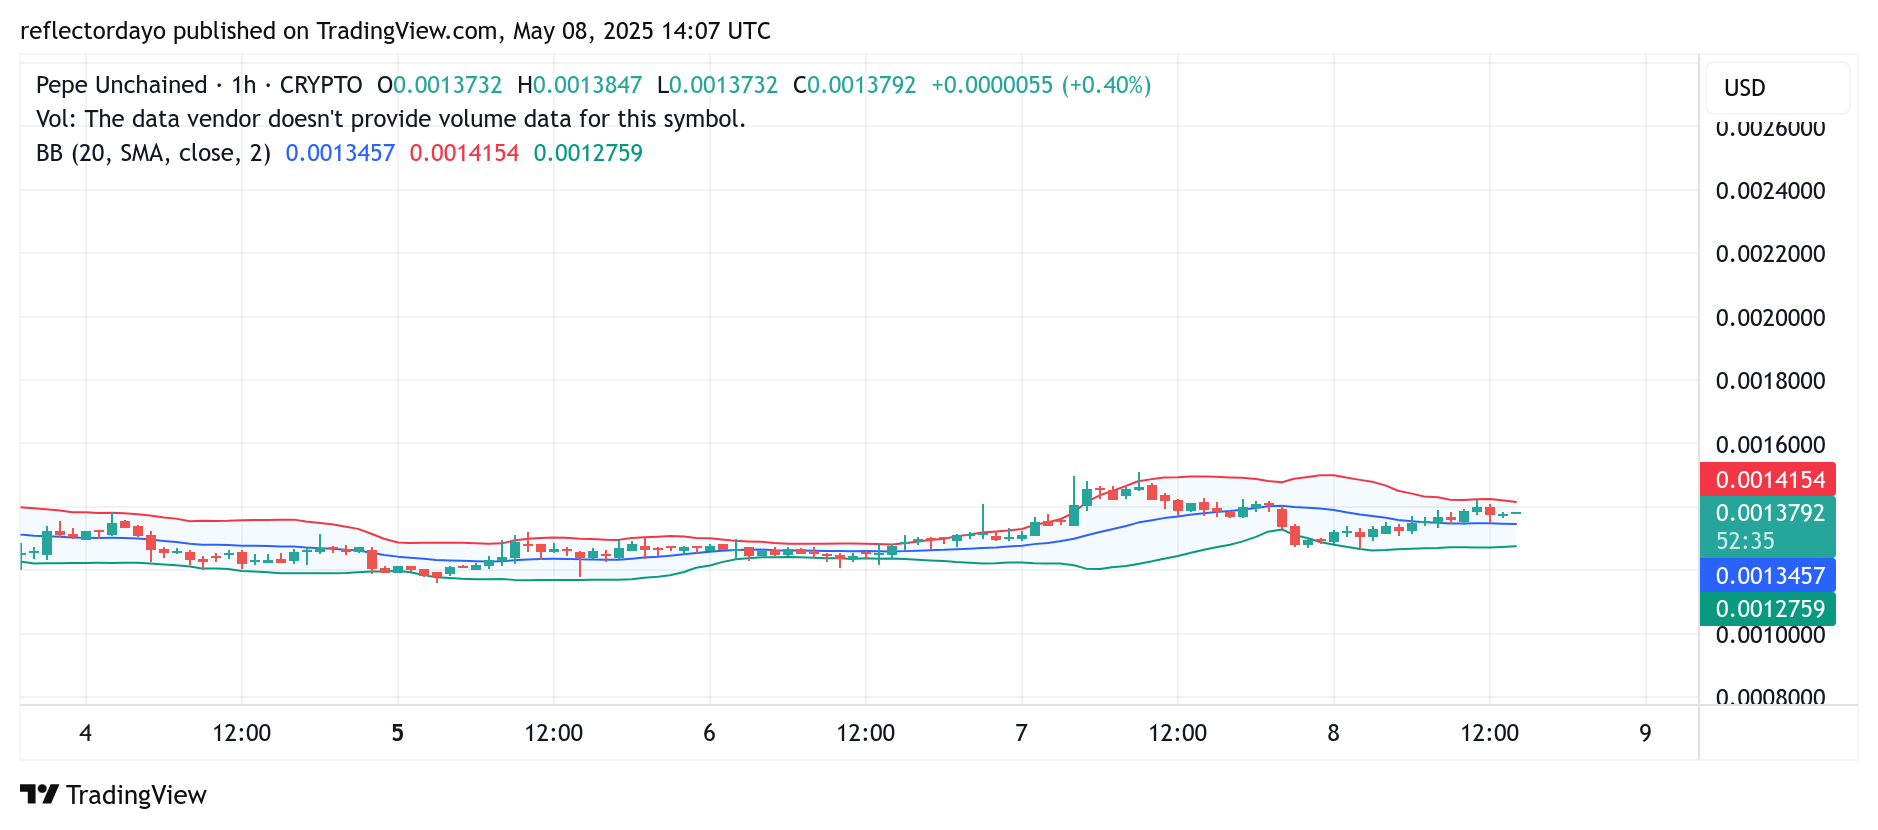
PEPU/USD 1-Hour Chart: Buyers Eye Breakout as Market Holds Steady Near Key Resistance
Zooming into the 1-hour chart, low volatility remains a defining characteristic of the current PEPU/USD market structure, as price continues to make minimal swings between buying and selling pressure.
A notable formation on the chart is the appearance of two four-price doji candlesticks—typically a sign of market indecision and equilibrium between bulls and bears. These doji appeared shortly after the market faced resistance at the $0.00014 level, suggesting a temporary pause in momentum.
The repeated emergence of these candlesticks around the $0.000137 zone—where bulls have previously shown resilience—indicates that buyers may be preparing for another push. With this base forming, bullish pressure could mount toward the $0.00015 level. A successful breakout above this resistance would signal renewed momentum and potentially shift short-term market sentiment more decisively in favor of the bulls.
How to Bridge Your $PEPU Back to Ethereum 🐸💚
◎ Disconnect wallets & clear browser data
◎ In MetaMask: Settings > Advanced > Reset Account
◎ Use wallet’s in-app browser only
◎ If staked, withdraw from L2
◎ Go to https://t.co/gdJvm55nvv
◎ Connect wallet & choose PEPU… pic.twitter.com/0D5TECglWq— Pepe Unchained (@pepe_unchained) May 5, 2025
Buy and stake NOW on the L2 for DOUBLE staking rewards! Pepe Unchained (PEPU)