OFFICIAL TRUMP (TRUMP/USDT) Faces Continued Downtrend, Struggling to Hold Above Key Support
Estimated Reading Time: 3 minutes
Don’t invest unless you’re prepared to lose all the money you invest. This is a high-risk investment and you are unlikely to be protected if something goes wrong. Take 2 minutes to learn more

In the last 24 hours, the market for Official Trump against Tether has fallen by 0.77%, extending bearish frontiers both on the weekly and monthly charts. As it stands, the token has unlocked 4.89 million since Nov. 17, as the crypto greed and fear indicator suggests extreme fear for the pair.
However, the price action on the daily chart indicates the pair appears to have been hovering around a spot for the last 3 days, projecting the impression that a bullish recovery might be on the way if the bulls can push the price above the $6.61 resistance area.
At the moment, the indicators on the daily timeframe suggest no impending sudden activity currently ongoing, but the oversold condition of the Stochastic RSI may trigger an upward move soon.
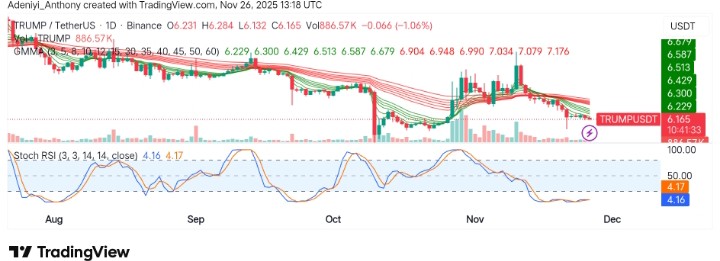
Currently, Official Trump trades at $6.165 with more than 886,000 volumes on the daily chart.
Technical Indicators
Major Resistance Levels: $6.610, $7.100, and $8.100
Major Support Levels: $6.100, $5.500, and $5.000
Technical Analysis
On the daily timeframe, Official Trump against Tether has revealed a strong and prolonged downtrend, moving below the Guppy Multiple Moving Averages (GMMA) as the Stochastic RSI continues to move on a straight line in the oversold region. However, the bearish signal on the daily chart appears weak with rising volume, reinforcing the struggle for any upward momentum.
To this end, if the price can hit above $6.610, a move into the $14.00 range may be recorded; otherwise, the trend may remain the same.
$TRUMP is entering a MAJOR reversal zone💥 After months of heavy correction, price is sitting perfectly inside the key demand area — a prime LONG zone for a macro bounce👨💻 If bulls defend this level, TRUMP could launch a powerful rally toward
$14.095 (T1)
$18.422 (T2)… pic.twitter.com/yCqOdb3PP0— Rose Premium Signals 🌹 (@VipRoseTr) November 23, 2025
Meanwhile, @VipRoseTr has suggested a reversal pattern for Official Trump. The analyst opined that the price of the token is now in an important zone for recovery after months of decline. Therefore, it was observed by the analyst that the token might hit some vital point above the current price level.
TRUMP/USDT Analysis: Facing Short-term Bearish Pressure
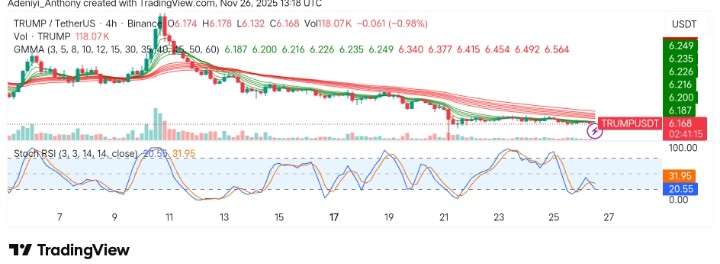
On the 4-hour chart, TRUMP/USDT appears to be faced with continuous bearish activity as the price lingers around $6.18 and $6.20. Meanwhile, the Stochastic RSI that signaled an upside move in the previous session now points south. This suggests the price in this timeframe may continue to oscillate on the spot if the $6.250 line remains intact.
To this end, the current price action on the smaller timeframe signals the presence of a strong bearish pressure, one that has all bullish attempts in check.
You can purchase crypto coins here. Buy Crypto