Litecoin (LTC) Price Prediction: LTC May Target the Next Psychological Price Level
Estimated Reading Time: 3 minutes
Don’t invest unless you’re prepared to lose all the money you invest. This is a high-risk investment and you are unlikely to be protected if something goes wrong. Take 2 minutes to learn more
Litecoin has recently resurfaced above the $80.00 mark. However, since the last price candle on the daily price chart found support above the mentioned price level about four sessions ago, the market retreated toward the $80.00 mark.
LTC/USDT Long-term Trend: Bullish (Daily Chart)
Key Levels:
Resistance Levels: $90.00, $100.00, and $110.00
Support Levels: $80.00, $70.00, and $60.00
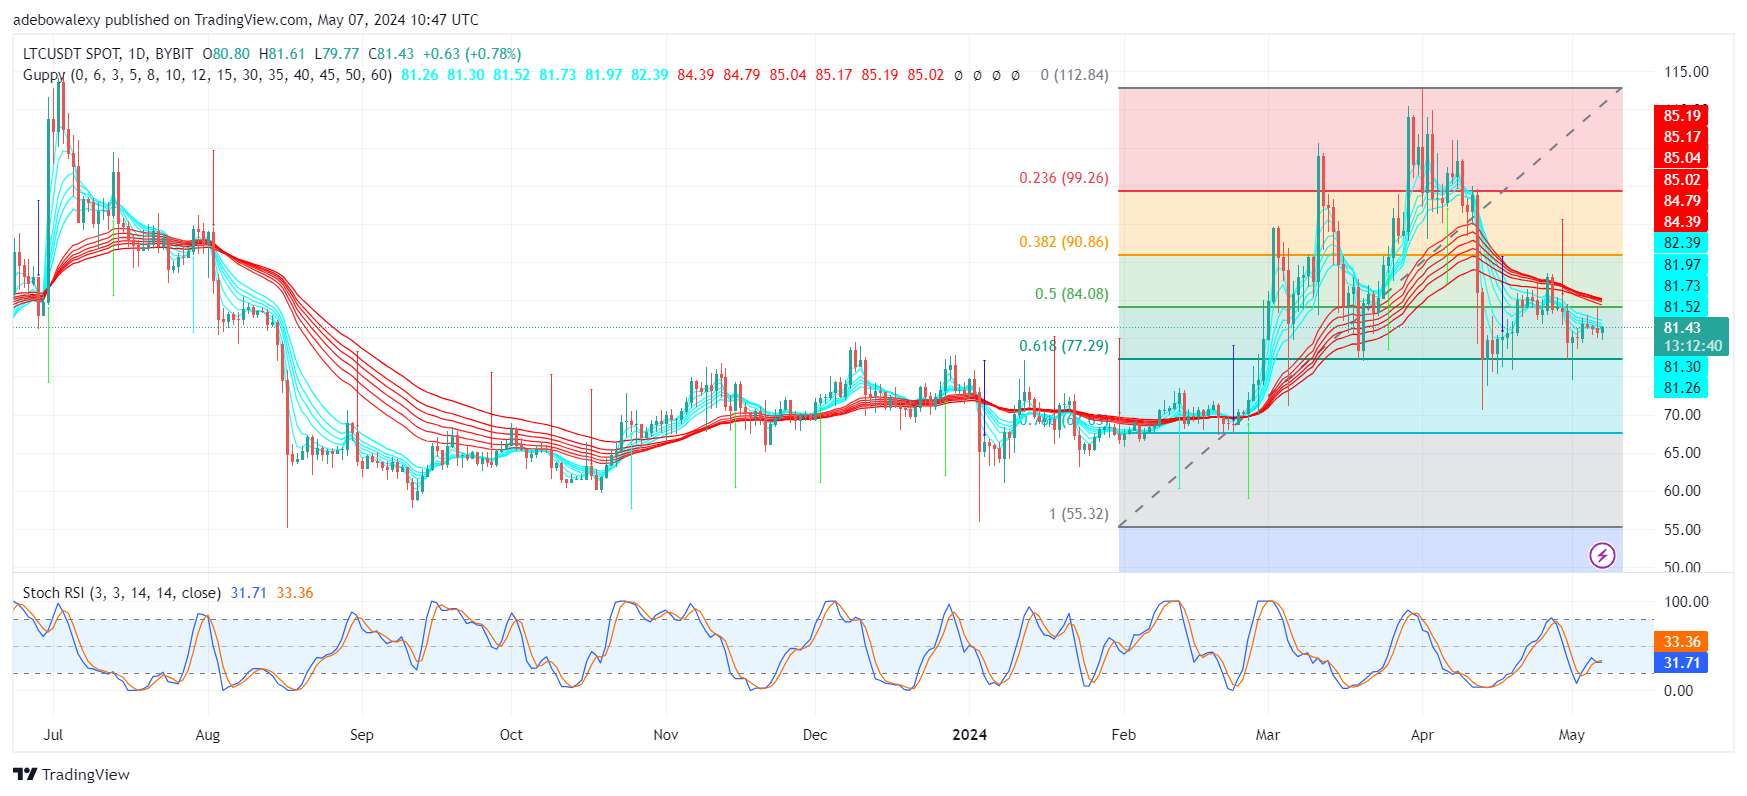
LTC/USDT-Daily Chart
On Litecoin’s daily price chart, price action has shown readiness to remain above the $80.00 mark. The last price candle on this chart has placed the current price of the token above two of the Guppy Multiple Moving Average (GMMA) lines. Meanwhile, a crossover can be seen on the Stochastic Relative Strength Index (SRSI) indicator.
This crossover could have signaled a further downward correction, but the appearance of a green price candle for the current session seems to resist that. Consequently, this maintains that the support level at the $80.00 price level may be quite dependable, and an upside correction may result from there.
Litecoin Price Prediction: What Are the Chances of This Market Approaching Higher Marks?
With price action already pushing upwards through the GMMA indicator lines and even above the newly found support at the $80.00 mark, prices may increase. This opinion stems from the fact that since price action has risen above the mentioned support level, trading activity has dwelled above that mark.
This may be largely because more traders may have placed an entry at that level. However, the SRSI indicator lines aren’t delivering much bullish conviction to the market. This could be seen as the crossover on this indicator seems printed sideways, thus lacking a clear direction. Nevertheless, considering the fact that the $80 support level is holding quite well, traders can at least hope that the market may approach the $84.00 mark.
LTC/USDT Medium-term Trend: Upside Correction Looks Stronger in the Litecoin Market (4-H Chart)
In the LTC 4-hour market, we can see that the spotted upside rebound is developing. Price activity had ended the downward correction towards the support level. Meanwhile, price movement in the upward direction grew more significantly in the subsequent session. At this point, the current session is testing the middle limit of the Bollinger Bands.
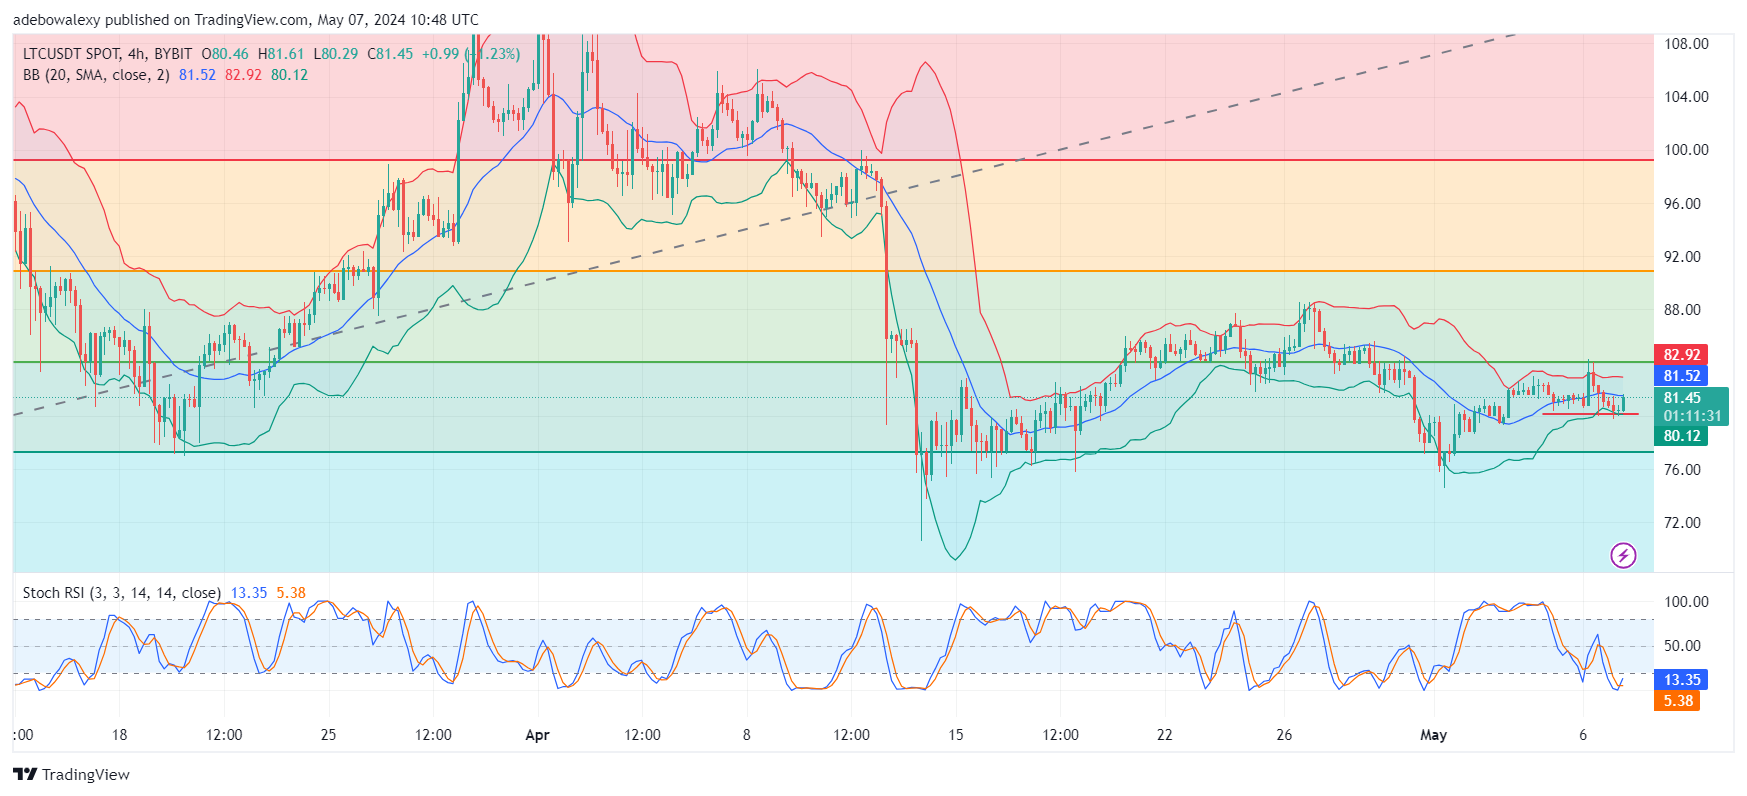
LTC/USDT 4-H Chart
At the same time, the SRSI indicator lines have reached deep into the oversold region and have delivered an upside crossover there. Consequently, this is in keeping with the speculation that the market may rise towards higher price levels. Therefore, it does seem a fair target to aim at the $85.00 price level in this market.