Pepe Unchained (PEPU/USD) Eyes Recovery Momentum from the $0.002 Support Zone
Estimated Reading Time: 3 minutes
Don’t invest unless you’re prepared to lose all the money you invest. This is a high-risk investment and you are unlikely to be protected if something goes wrong. Take 2 minutes to learn more

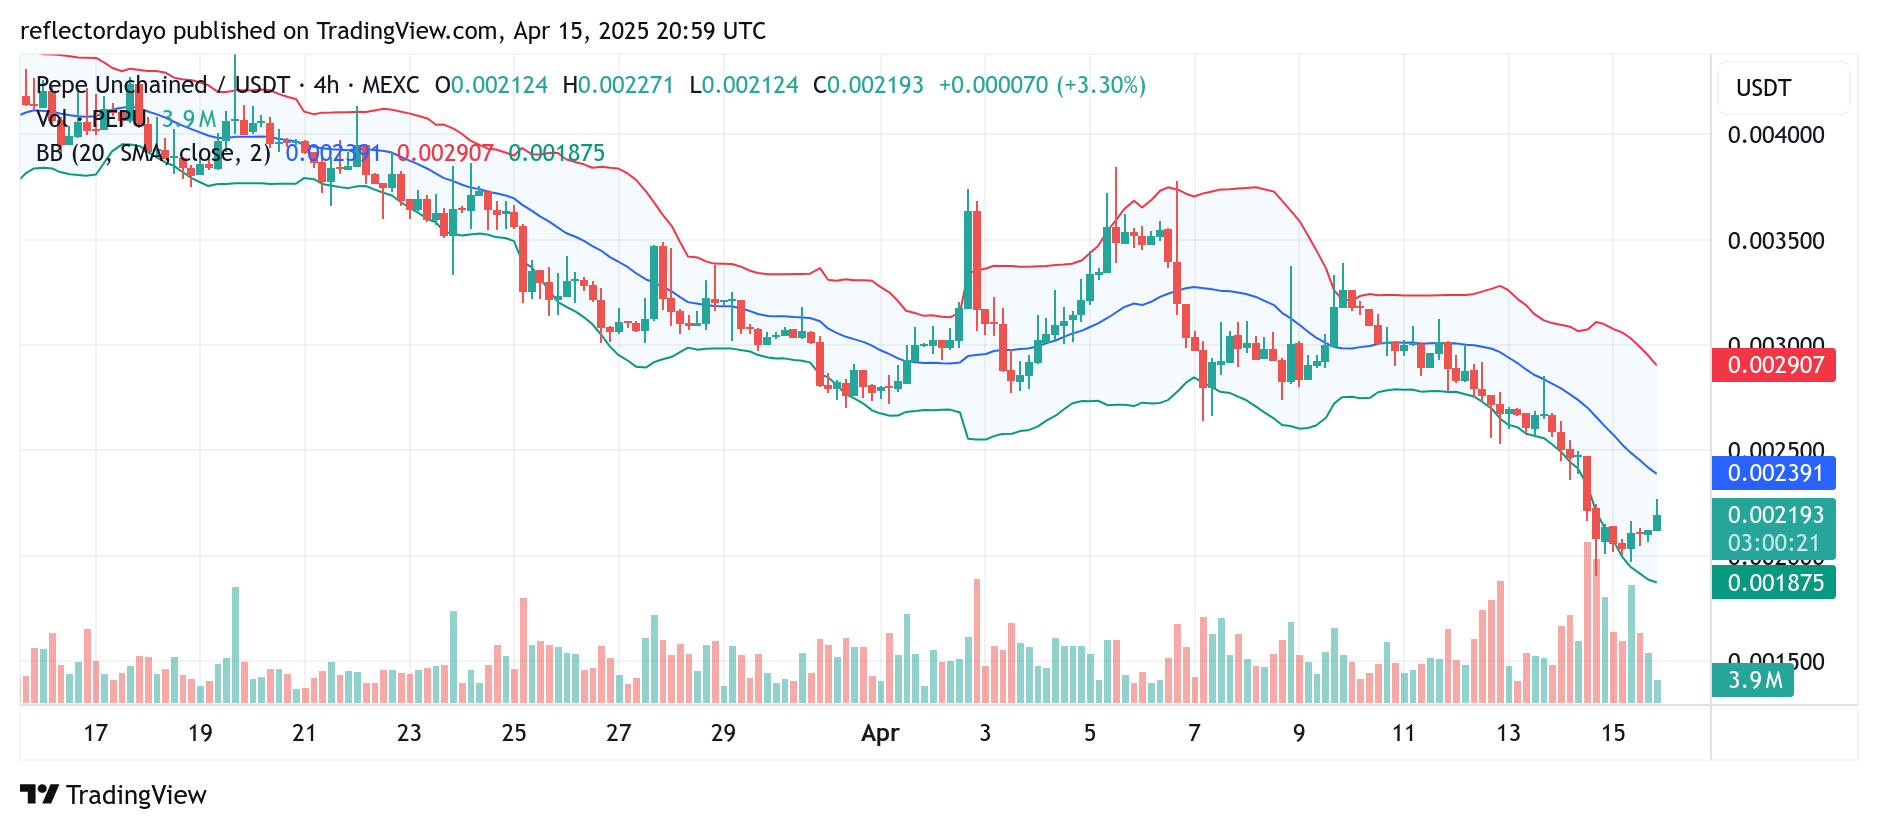
Recently, the Pepe Unchained (PEPU/USD) market struggled to hold the $0.003 price level amid persistent bearish pressure. Contrary to expectations of a bullish breakout, the market failed to sustain that level and eventually broke below it, triggering a wave of sell-offs that fueled a deeper bearish move.
Currently, the market appears to be finding support around the $0.002 level, which is acting as a potential springboard for a recovery. A minor rally has since followed, lifting the price to approximately $0.00227. However, the emergence of a corrective pullback at this point suggests that bearish sentiment still lingers, and traders may remain cautious as the market tests the strength of this support zone.
Key Levels to Watch
- Resistance: $0.007, $0.008, $0.009
- Support: $0.0020, $0.0015, $0.0011
Pepe Unchained Market Outlook: Bullish Effort Meets Resistance Amid Volatility Shift
Following the breakdown below the $0.003 price level, the Pepe Unchained market experienced a significant surge in bearish liquidity. This was reflected in a sharp increase in trading volume and heightened market volatility, fueled by aggressive selling pressure.
However, as bullish intervention emerged around the $0.002 support level, the volume histograms began to decline noticeably—an indication of reduced momentum. This drop in volume may also be attributed to the growing battle between supply and demand that surfaced after the initial bullish response.
At present, the market is printing a bullish candlestick with an upper shadow, suggesting a corrective move after reaching the $0.00227 level. The brief hesitation around the $0.0021 zone may become a critical point of interest. If the correction dips to this level, it could present an entry opportunity for traders looking to go long.
PEPE/USD Short-Term Analysis: Volatility Squeeze Hints at Impending Breakout
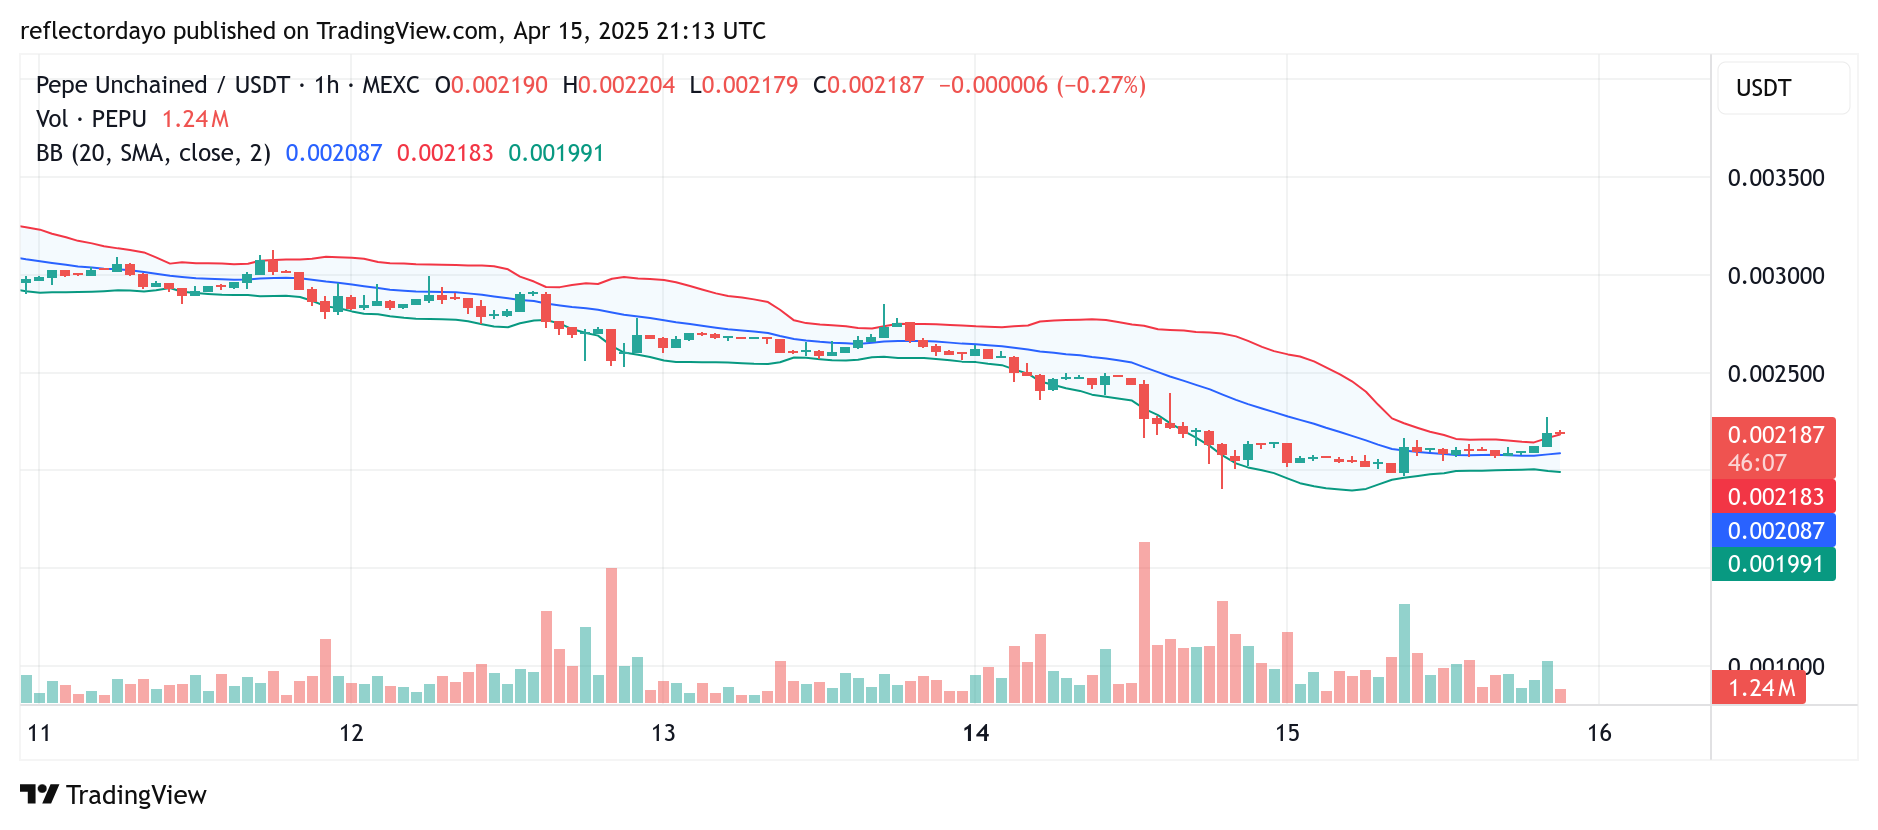
Zooming into the 1-hour chart for a closer look at the PEPE/USD market, price action currently shows a notable standstill, with the latest candlestick holding at $0.002187. This state of indecision is further confirmed by the presence of a four-price Doji, a candlestick pattern often signaling market hesitation.
In addition, trading volume is on the decline, pointing to a volatility squeeze—a condition that frequently precedes a breakout. With bearish momentum appearing to wane, there is a strong possibility that the next significant move will favor the bulls.
Buy and stake NOW on the L2 for DOUBLE staking rewards! Pepe Unchained (PEPU