RNDR/USD: Render Token Climbs Towards $4, Bullish Trend Emerges
Estimated Reading Time: 2 minutes
Don’t invest unless you’re prepared to lose all the money you invest. This is a high-risk investment and you are unlikely to be protected if something goes wrong. Take 2 minutes to learn more
The Render token market recently initiated a significant attempt to reverse the prolonged bearish trend that commenced around December 5th of the previous year. This downtrend, originating near the $11.50 price level, witnessed a limited bullish recovery to a low of approximately $2.50 on March 11th. The market has experienced substantial selling pressure. Despite this, buyers have maintained a consistent recovery effort. A detailed chart analysis will provide further insight.
Render Token Market Data
- RNDR/USD Price Now: $3.80
- RNDR/USD Market Cap: $1.98 million
- RNDR/USD Circulating Supply:517.7 million RNDR
- RNDR/USD Total Supply:532.5 million RNDR
- RNDR/USD CoinMarketCap Ranking: #50
Key Levels
- Resistance: $4.00, $4.50, and $5.00
- Support: $3.00 $2.50, and $2.00
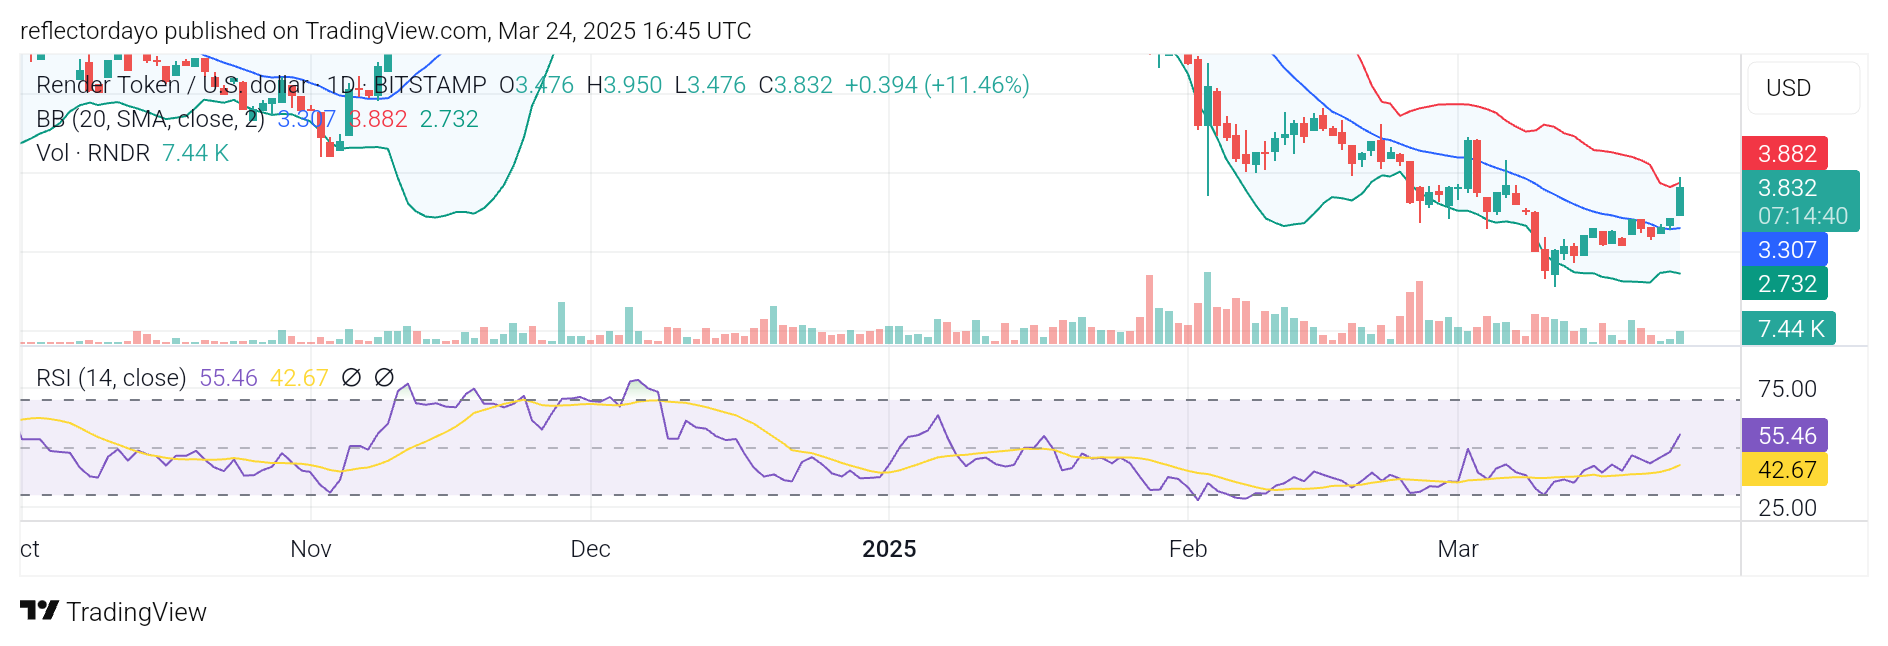
Render Token Through the Lens of Indicators
The Bollinger Bands indicate significant market volatility. This volatility has enabled buyers to initiate a strong bullish recovery. The bands’ range extends from $2.70 to $3.80. The Render Token buyers capitalized on the volatility, confirming a bullish recovery as the price rallied and surpassed the 20-day moving average. However, nearing the $4.00 level, profit-taking is evident in this crypto signal as indicated by a developing upper shadow on the daily candlestick. Given the prevailing market volatility, sellers may exhibit strong resistance at $4.00. Should a price rejection occur, support could form around $3.00.
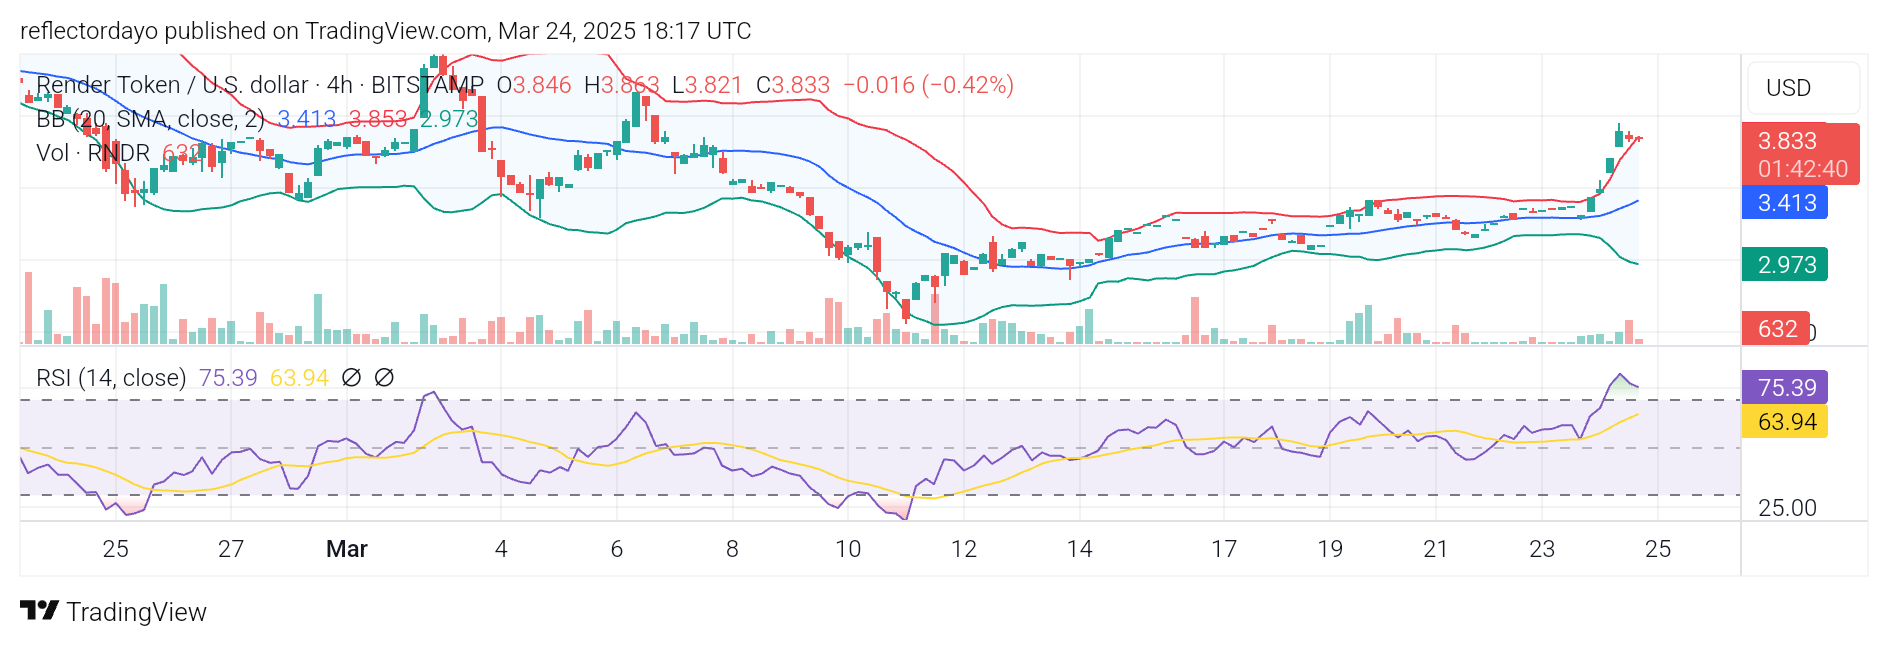
RNDR/USD Price Prediction: 4-Hour Chart Analysis
Analyzing a lower timeframe reveals detailed price behavior. While exhibiting signs of correction, the market has entered overbought territory due to recent strong bullish activity. The Bollinger Bands indicate a surge in volatility driven by aggressive buying. The widening Bollinger Bands further confirm this increased volatility. Consequently, traders should anticipate potential price rejection at the key $4.00 level.