Skale Network (SKL/USD): Bulls Set Their Sights on the $0.08 Milestone
Estimated Reading Time: 3 minutes
Don’t invest unless you’re prepared to lose all the money you invest. This is a high-risk investment and you are unlikely to be protected if something goes wrong. Take 2 minutes to learn more

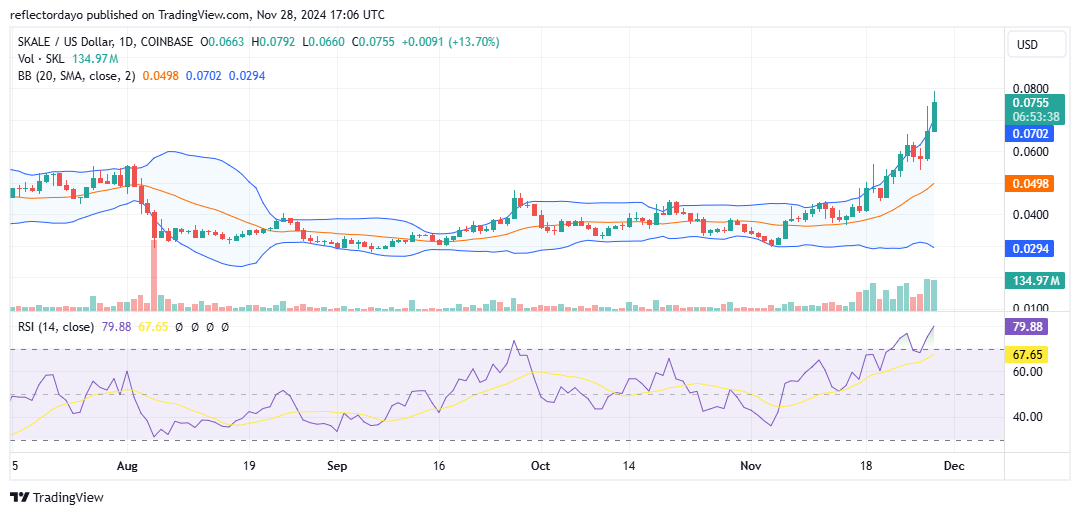
The Skale Network has been gaining upward momentum since yesterday, overcoming a strong bearish resistance line and now targeting the $0.08 price level. The market experienced a significant shift after decisively breaking out from the $0.06 level following a brief period of contention between demand and supply. This clear breakout at $0.06 has fueled bullish sentiment, driving the market steadily toward the $0.08 mark.
Skale Network Market Data
- SKL/USD Price Now: $0.076
- SKL/USD Market Cap: $424.6 million
- SKL/USD Circulating Supply: 5.54 billion SKL
- SKL/USD Total Supply: 5.98 billion SKL
- SKL/USD CoinMarketCap Ranking: #171
Key Levels
- Resistance: $0.08, $0.09, and $0.10
- Support: $0.07, $0.06, and $0.05.
Skale Network Through the Lens of Indicators
Although bullish momentum in this market remains strong, traders should carefully observe the upper shadows on both yesterday’s and today’s candlesticks. These upper shadows indicate bearish activity as the market pushes upward, signaling that caution is warranted. Unless the crypto market establishes a solid support level and shows signs of stability, entering bullish positions may carry significant risk.
The $0.07 level appears to be a likely candidate for support, given the strength of the ongoing bullish trend. However, the Relative Strength Index (RSI) is currently at 80, indicating overbought conditions. Even if the bullish momentum continues, the Skale Network market may struggle to break through the $0.08 resistance level, as traders are already taking profits near this point. Consequently, $0.07 presents itself as a promising support level for potential stabilization.
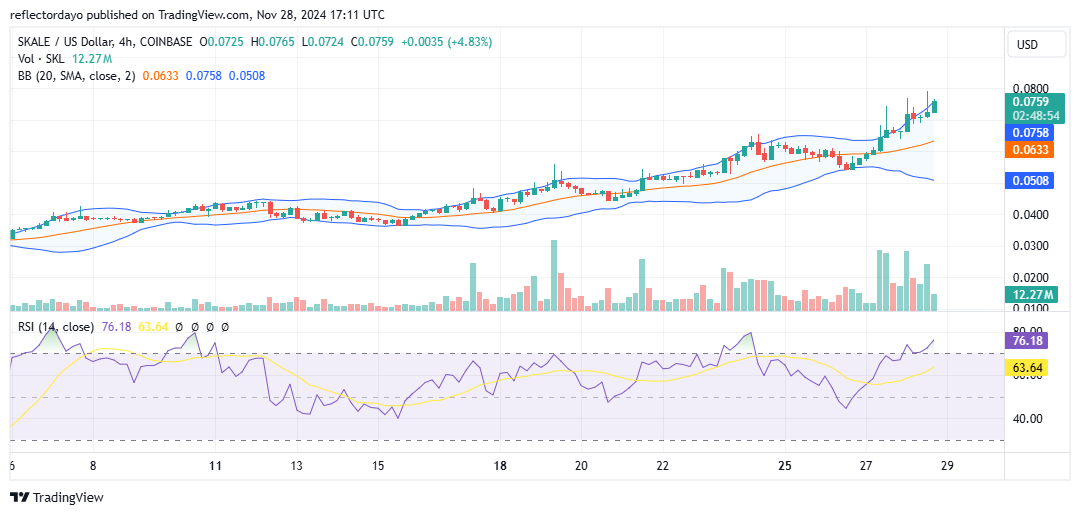
SKL/USD Price Prediction: 4-Hour Chart Analysis
From the perspective of the 4-hour chart, the bullish trend in the market appears both promising and consistent. The chart reveals a pattern of higher lows and higher highs, indicating sustained upward momentum. Recent trading sessions show a gradual climb in price peaks as the market approaches the $0.08 level.
Notably, the market exhibited a brief consolidation around $0.07, highlighting this level as a potential support zone in the event of a correction. The ongoing trading sessions, however, are characterized by the formation of a strong bullish candlestick, reinforcing the market’s upward bias.
That said, attention should remain focused on the $0.08 resistance level and the $0.07 support level to assess how the market reacts in the near term. These levels will likely play pivotal roles in determining the next phase of price action.