Skale Network (SKL/USD) Surges to New Heights, Aiming for the Bullish $0.100 Milestone
Estimated Reading Time: 2 minutes
Don’t invest unless you’re prepared to lose all the money you invest. This is a high-risk investment and you are unlikely to be protected if something goes wrong. Take 2 minutes to learn more
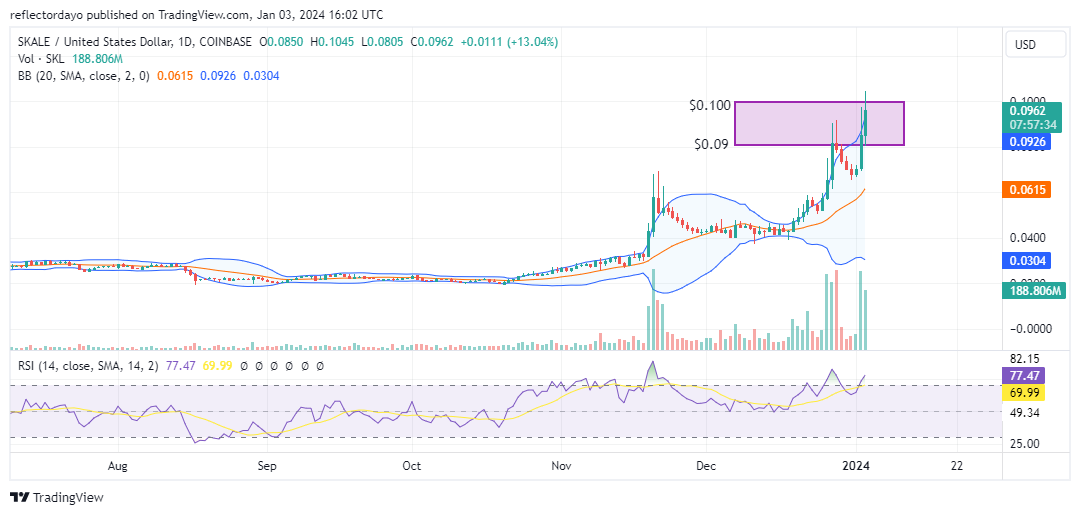
Throughout the majority of the previous year, the Skale Network market exhibited minimal price fluctuations. However, in line with many cryptocurrency markets, there was a shift from a bearish to a bullish trend, which intensified towards the year’s end. As we commence the new year, amidst heightened volatility and a notable support level established around $0.0676, the market has once again adopted a bullish trajectory.
Skale Network Market Data
- SKL/USD Price Now: $0.0955
- SKL/USD Market Cap: $215,500,657
- SKL/USD Circulating Supply: 5,134,227,671 SKL
- SKL/USD Total Supply: 5,447,166,667 SKL
- SKL/USD CoinMarketCap Ranking: #121
Key Levels
- Resistance: $0.100, $0.110, and $0.120.
- Support: $0.085, $0.080, and $0.075.
Skale Network Market Forecast: Analyzing the Indicators
The Bollinger Bands indicator suggests a Skale Network market characterized by significant volatility, yet it also indicates the formation of an upward price channel. Both the upper and lower standard deviations, along with the 20-day moving average, are trending upward, underscoring bullish market dominance. While increased volatility has led the market to approach bearish territory, marked by pronounced bearish resistance, there remains potential for the market to surpass the pivotal $0.100 price level.
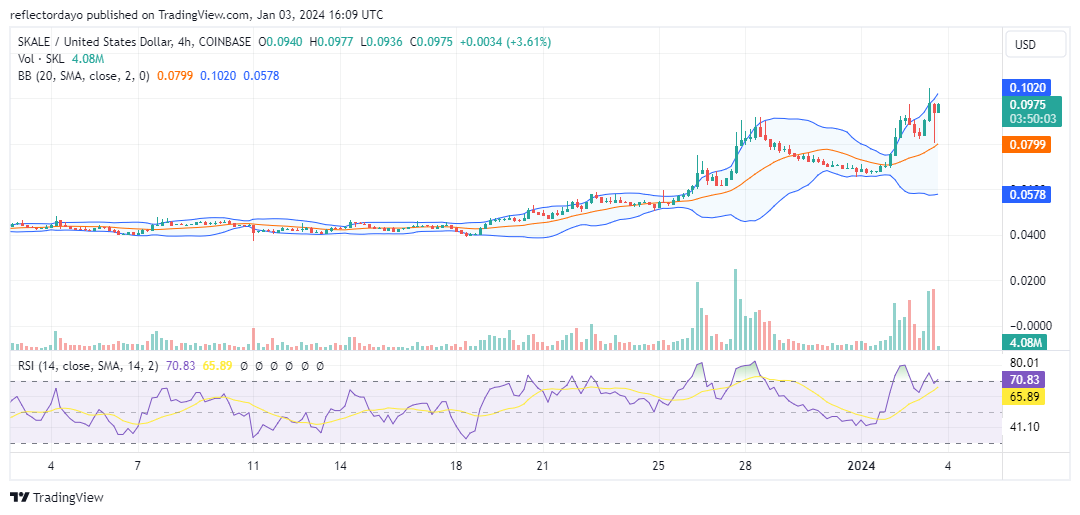
SKL/USD 4-Hour Chart Outlook
Upon examining the market from a 4-hour chart perspective, indications suggest that the bullish trend might have further potential. The appearance of the hammer candlestick pattern suggests that bullish momentum remains robust relative to bearish sentiment, with the critical $0.100 price level still within reach. Nevertheless, an alternative analysis reveals potential weakening in the bull market, as evidenced by the modestly descending peaks of the RSI line and the diminished size of the current trading session’s histogram. These factors suggest that bullish momentum could be waning as the market approaches the $0.100 threshold.