Hedera Hashgraph (HBAR/USD) Aims to Break the $0.100 Barrier
Estimated Reading Time: 3 minutes
Don’t invest unless you’re prepared to lose all the money you invest. This is a high-risk investment and you are unlikely to be protected if something goes wrong. Take 2 minutes to learn more
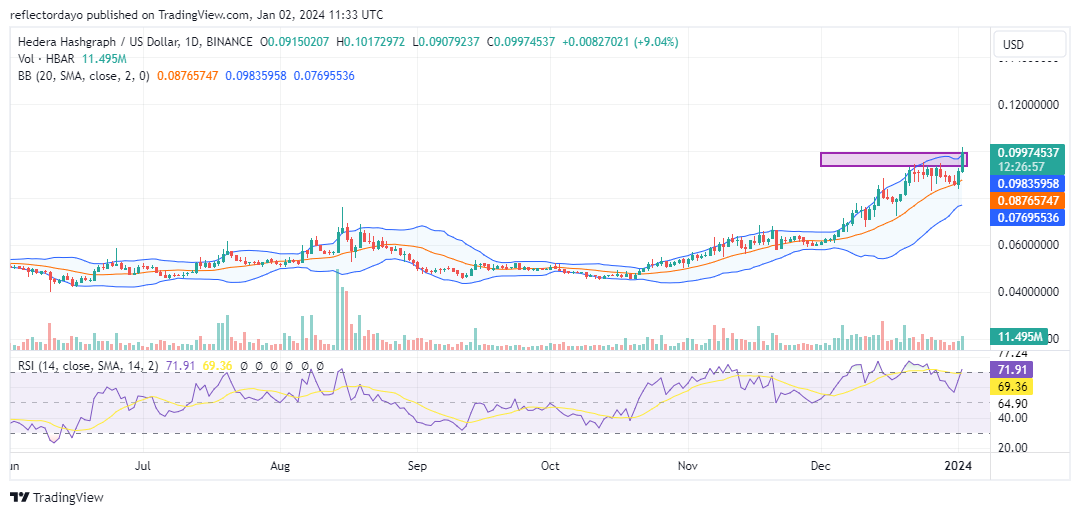
In December, Hedera Hashgraph experienced significant bullish momentum with the objective of reaching the $0.100 price threshold by year-end. Nevertheless, given that many traders also targeted this price level, a resistance zone emerged between $0.0936 and $0.100. Consequently, the bullish market momentarily yielded to pressure, resulting in a price decline. The downturn persisted until the bulls identified a strong support level at $0.086.
Hedera Hashgraph Market Data
- HBAR/USD Price Now: $0.099
- HBAR/USD Market Cap: $3,327,716,861
- HBAR/USD Circulating Supply: 33,617,884,868 HBAR
- HBAR/USD Total Supply: 50,000,000,000 HBAR
- HBAR/USD CoinMarketCap Ranking: #30
Key Levels
- Resistance: $0.100, $0.110, and $0.120.
- Support: $0.085, $0.080, and $0.075.
Hedera Hashgraph Market Forecast: Analyzing the Indicators
In December, Hedera Hashgraph experienced significant bullish momentum, generating heightened interest among traders and investors as the market approached the pivotal $0.100 price level. This surge in trading activity led to an increase in trading volume, with demand closely aligning with supply. As a result, the market exhibited stagnation towards the end of December, falling short of its target. However, the bullish trend was revitalized when bulls identified a critical support level at $0.086 between December 31 and January 1, subsequently propelling the price towards the $0.100 mark.
While indicators currently display robust bullish signals for the market, the pronounced bullish sentiment has pushed the market into overbought territory. Early indications of a corrective phase are evident in today’s candlestick patterns. Nonetheless, the prevailing market sentiment remains predominantly bullish.
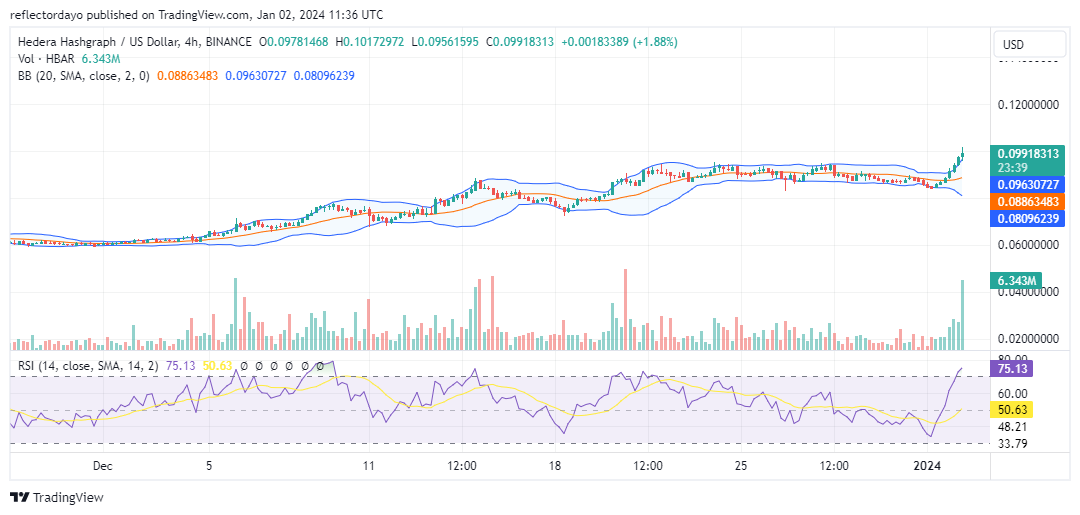
HBAR/USD 4-Hour Chart Outlook
Upon examining the 4-hour chart, the prevalence of bullish dominance becomes more evident. This surge in bullish market dynamics has also heightened market volatility. It’s important to recognize that such increased volatility can have dual implications, potentially leading to significant price retracements or even reversals.
Furthermore, a notable divergence is observed between the trading volume histogram of the current 4-hour session and the formation of an inverted hammer candlestick. These indicators suggest that bears are gaining momentum and strength, raising the possibility of a market downturn.