Bitcoin (BTC/USD) Price Is Mustering a Catalyst, Striving for Rises
Estimated Reading Time: 3 minutes
Don’t invest unless you’re prepared to lose all the money you invest. This is a high-risk investment and you are unlikely to be protected if something goes wrong. Take 2 minutes to learn more
Bitcoin Price Prediction – July 27
Bitcoin’s price is mustering a catalyst, striving for rises against the market valuation of the US currency from the psychological lower range point of $30,000, surfacing at higher trading spots that have peaked below the $32,000 resistance line some time ago.
Even though there have been pressures indicating that purchasers are attempting to surge back, a line of precautionary trade techniques must be adhered to when launching some order executions. Another technical viewpoint, however, contends that bears cannot ignore a consolidation moving picture at this moment. In order to protect any immediate long position orders, a stop-loss order should be placed closely below the point of $28513.78.
BTC/USD Market
Key Levels:
Resistance levels: $31,000, $33,000, $35,000
Support levels: $28,000, $27,000, $26,000
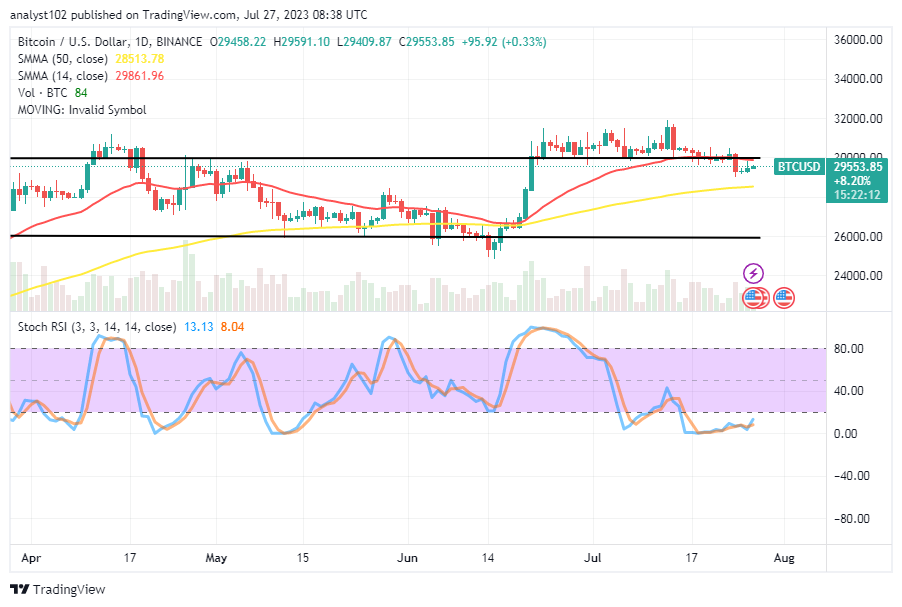
BTC/USD – Daily Chart
The BTC/USD daily chart showcases that the crypto-economic price is mustering a catalyst, striving for rises from variant close lower points below the level of $30,000.
The 14-day SMA indicator is at $29,861.96 above the $28,513.78 value of the 50-day SMA indicator. In order to consolidate between 13.13 and 8.04, the Stochastic Oscillators have slipped into the oversold area. A line of three different smaller bullish candlesticks that developed about three days ago indicated a dowse moment for the most recent retracement operations.
What should purchasers do in response to the 14-day SMA, given the BTC/USD market’s current pace of gradual increases?
In order to avoid losing momentum back to the downside going upward from the present trade capacity of the BTC/USD market bulls, price has to forcibly push past the smaller SMA trend line, as it has been observed that the crypto-economic market is mustering a catalyst, striving for rises.
The positioning view of the majority of the lower trade charts, which indicates that a movement back to the north is imminent before pressing for buy orders afterward, also needs to be taken into consideration while determining buying actions at this point in the longing side of this technical analytical piece.
On the negative side of technical analysis, sellers may regain market control by rejecting surges that are likely to prove false around the resistance levels of $31,000 or, in turn, $32,000. If the anticipated trade situation persists over an extended period of time, a frightening breakout of those values may result in the establishment of even higher range-bound places.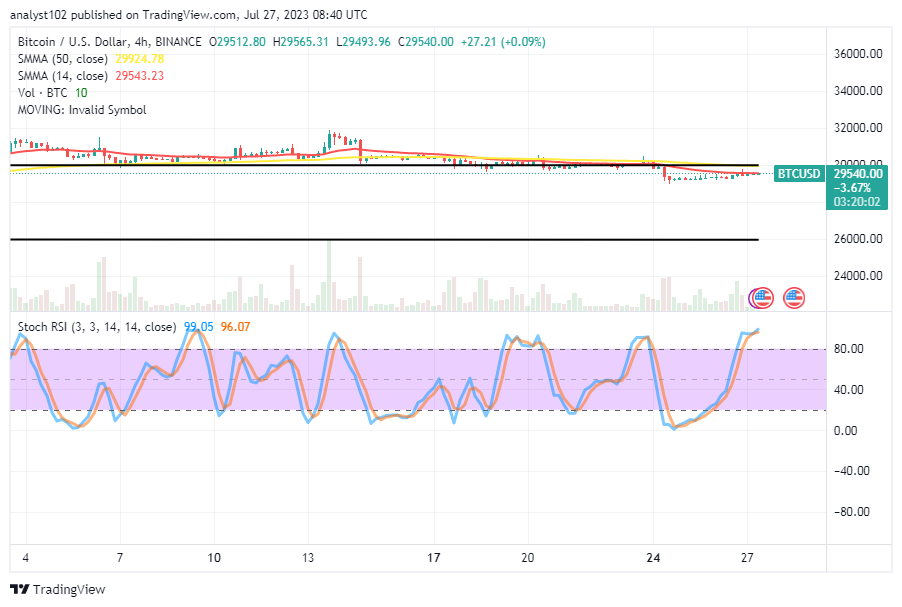
BTC/USD 4-hour Chart
The BTC/USD 4-hour chart shows the crypto-economic price is mustering a catalyst, striving for a rise closely below the SMA trend lines.
The 50-day SMA indicator’s price of $29,924.78 is below the 14-day SMA indicator’s price of $29,543.23. The medium-term run prognosis of this trade has been impacted to varying degrees by rising lows. And as a result of their actions, the stochastic oscillators are now fully positioned northbound between 96.07 and 99.05.
Note: Cryptosignals.org is not a financial advisor. Do your research before investing your funds in any financial asset or presented product or event. We are not responsible for your investing results.
You can purchase Lucky Block here. Buy LBLOCK