DeFi Coin Price Prediction: More Buyers Will Surface as DEFC/USD Claims $0.093 Level
Estimated Reading Time: 3 minutes
Don’t invest unless you’re prepared to lose all the money you invest. This is a high-risk investment and you are unlikely to be protected if something goes wrong. Take 2 minutes to learn more

Free Crypto Signals Channel
The DeFi Coin price prediction reveals that DEFC will gain more upsides as the coin continues to follow the upward movement.
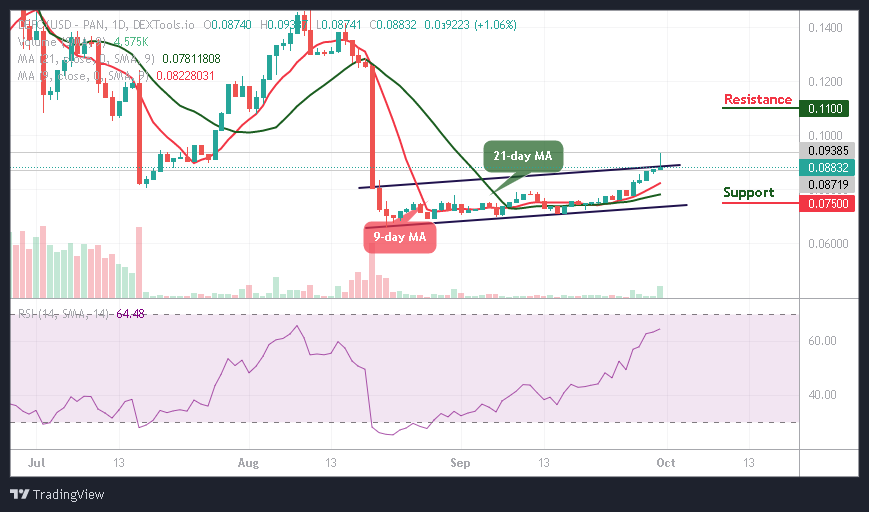
DEFC/USD Medium-term Trend: Bullish (1D Chart)
Key Levels:
Resistance levels: $0.110, $0.115, $0.120
Support levels: $0.075, $0.070, $0.065
DEFC/USD crosses above the upper boundary of the channel to touch the daily high at the $0.093 resistance level. According to the daily chart, the DEFC price has been increasing as buyers dominate the market. At the moment, DEFC/USD remains above the 9-day and 21-day moving averages as the signal line of the technical indicator Relative Strength Index (14) stays above the 60-level, confirming the bullish movement within the channel.
DeFi Coin Price Prediction: DEFC Bulls Will Keep Moving Upward
According to the daily chart, the DeFi Coin price remains above the 9-day and 21-day moving averages, waiting to reclaim the previous resistance at $0.093. However, if the coin maintains the bullish trend, the bulls would push the price towards the resistance levels of $0.110, $0.115, and $0.120. On the contrary, if DEFC/USD drops below the moving averages, it could touch the support levels at $0.075, $0.070, and $0.065.
DEFC/USD Medium-term Trend: Bullish (4H Chart)
The DeFi Coin keeps hovering above the 9-day and 21-day moving averages as the technical indicator Relative Strength Index (14) remains within the overbought region which increases the bullish movement. On the other hand, if the price faces the negative side, it could create a new monthly and any further bearish movement could bring the coin to the support level of $0.083 and below.
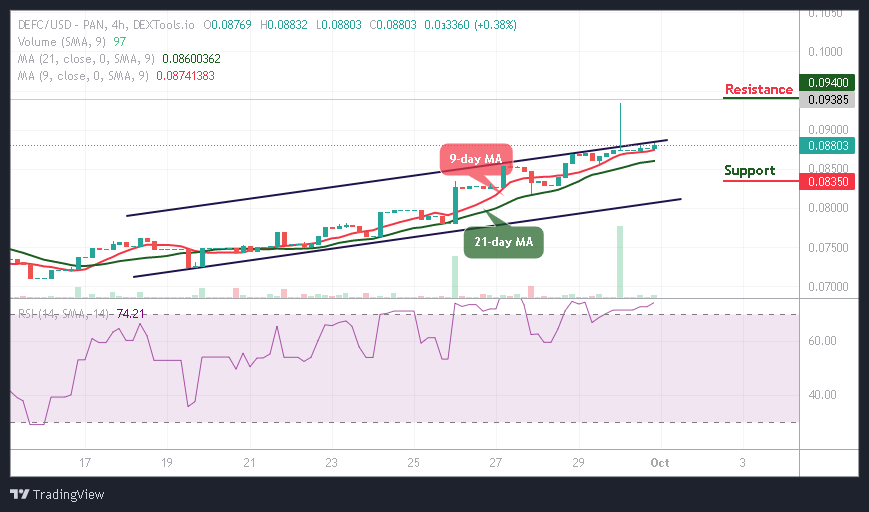
However, the DEFC price will cross above the upper boundary of the channel if the buyers increase the buying pressure and this will cause the market price to hit the resistance level of $0.094 and above. Similarly, the coin will continue with the bullish movement if the technical indicator Relative Strength Index (14) stays within the overbought region.
You can purchase DeFi Coin here. Buy DEFC