Solana (SOL/USD) Bullish Momentum Pushes Price Higher
Estimated Reading Time: 3 minutes
Don’t invest unless you’re prepared to lose all the money you invest. This is a high-risk investment and you are unlikely to be protected if something goes wrong. Take 2 minutes to learn more
Since establishing pivotal support at the $125 level on June 22, marking the bottom of the preceding downtrend, the Solana market has been trending upward. Initially, the recovery was gradual, with limited traction in price movement. However, recent sessions show that momentum has strengthened considerably.
So far this week, SOL has maintained a steady and progressive uptrend, signaling renewed bullish confidence and sustained upward pressure in the market.
Solana (SOL/USD) Market Data
- SOL/USD Price Now: $238
- SOL/USD Market Cap: $129 billion
- SOL/USD Circulating Supply: 542 million SOL
- SOL/USD Total Supply: 609 million SOL
- SOL/USD CoinMarketCap Ranking: #5
Key Levels
- Resistance: $240, $250, and $260
- Support: $200, $180, and $170
Solana (SOL/USD) Daily Chart Outlook
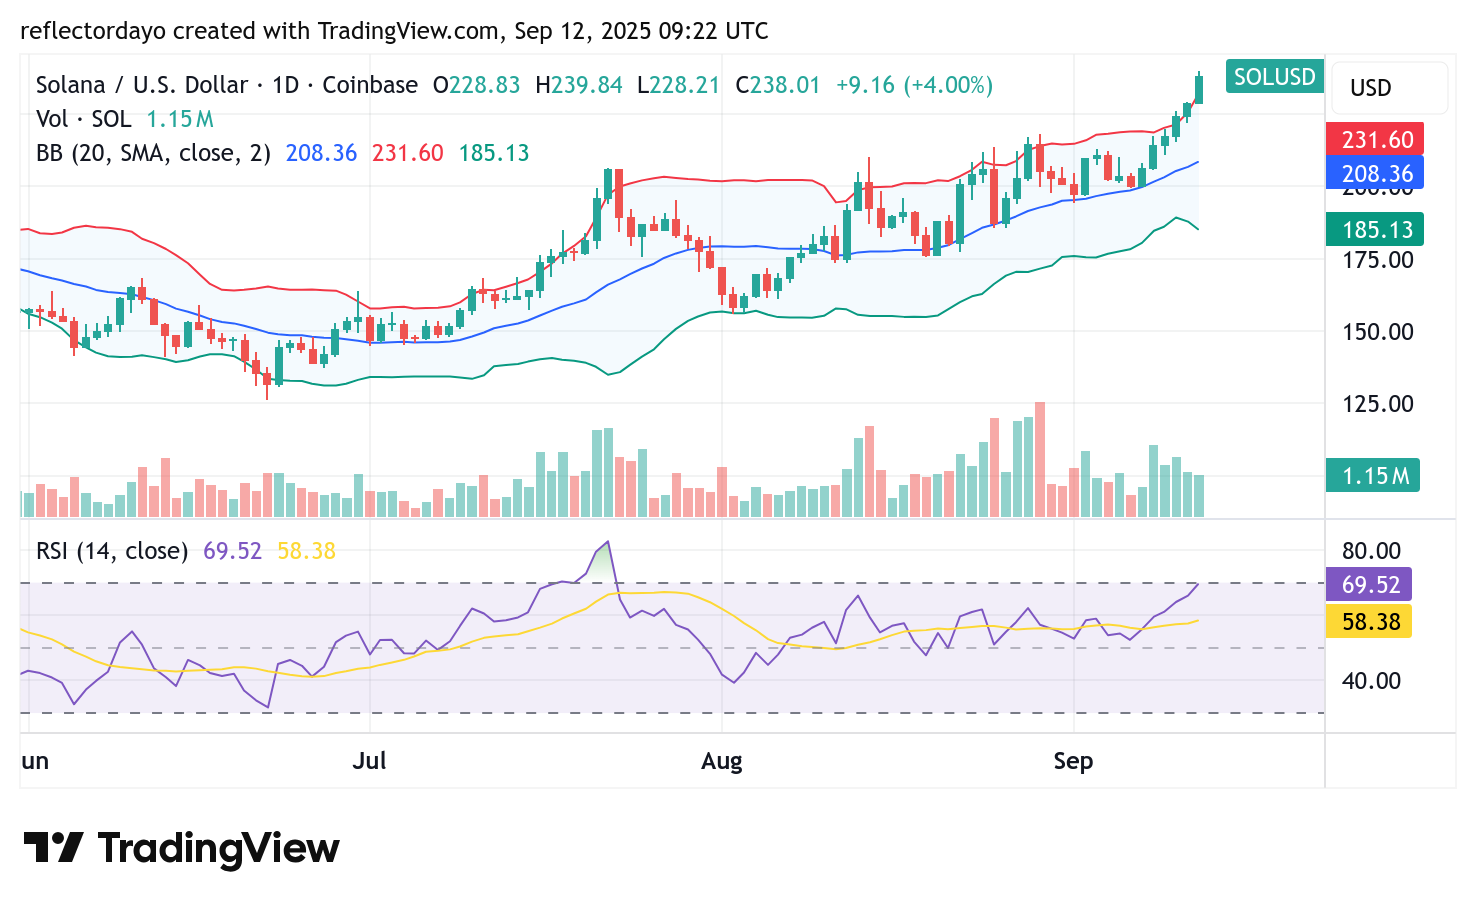
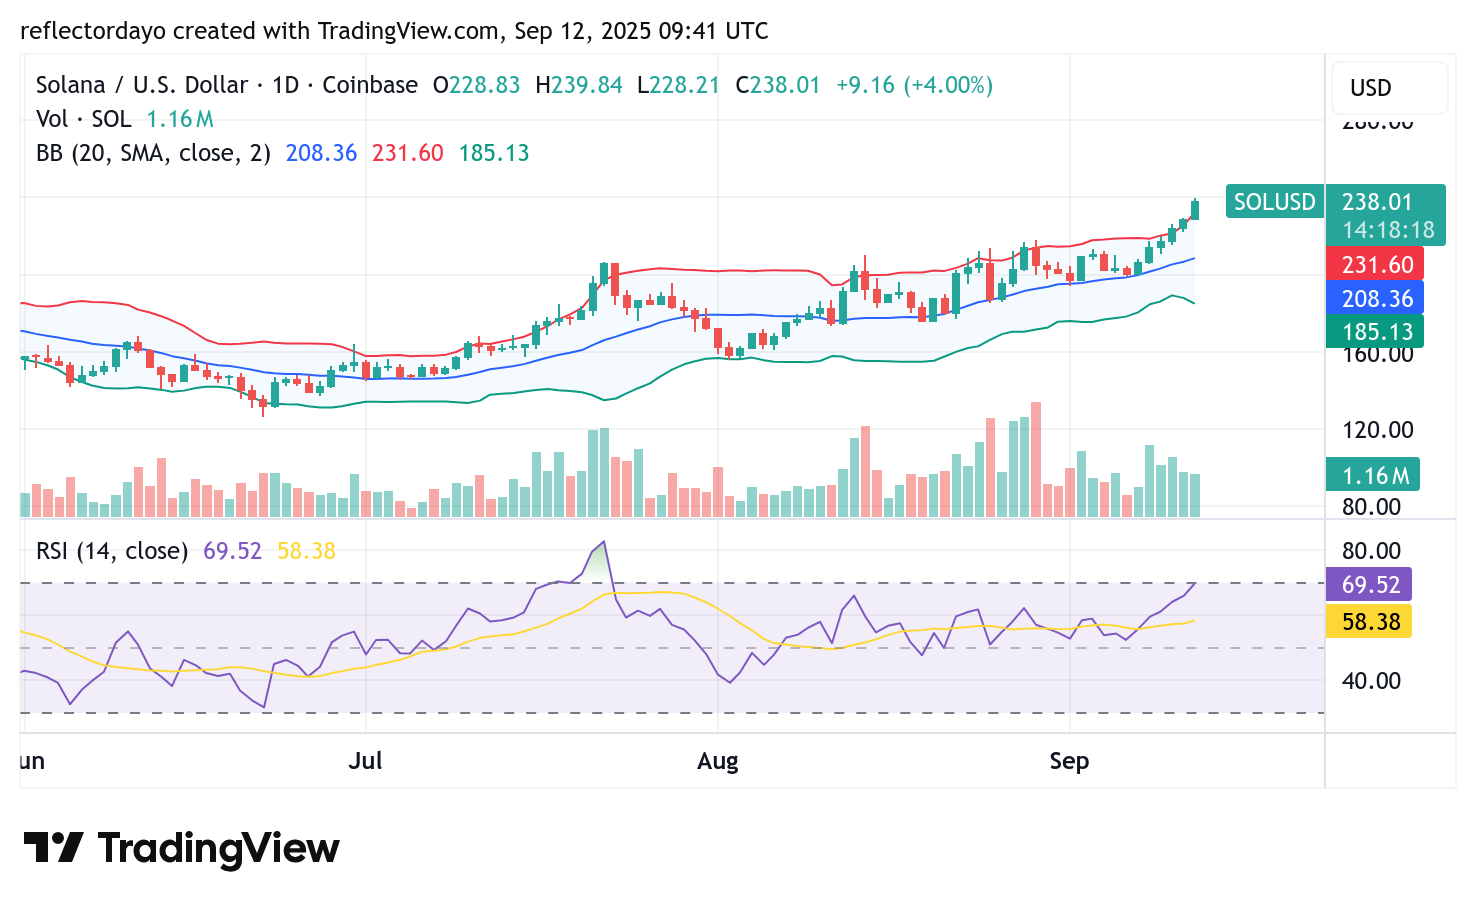
The Bollinger Bands are clearly highlighting an established upward trend. Since mid-August, the daily chart shows that price action has consistently traded above the 20-day moving average, reinforcing bullish momentum. During this period, the Solana market applied sustained pressure on the critical $200 resistance level.
By the end of August, bulls successfully broke above this barrier and converted it into support. Currently, price action is approaching another key resistance zone, where momentum may face a formidable test. Additionally, the Relative Strength Index (RSI) is edging closer to overbought territory, suggesting that a potential correction or consolidation could occur before further upside continuation.

SOL/USD 4-Hour Chart Outlook
On the 4-hour timeframe, Solana (SOL/USD) is already trading in the overbought zone, with the RSI surging above 70 and currently hovering around 79. This reflects strong bullish momentum but also signals that a potential correction could be imminent.
In the past two trading sessions, the market has tested a key resistance level, where traders are beginning to identify this point as a significant barrier. Meanwhile, the sharp decline in histogram bars indicates growing caution among participants, as demand and supply forces appear to be clashing near this resistance.
If profit-taking triggers a correction, the $223 price level could emerge as a potential reentry zone for traders looking to ride the next bullish wave.