SPONGE/USD ($SPONGE) Bullish Sentiment Persists, Despite the Price Rejection at $0.000095
Estimated Reading Time: 2 minutes
Don’t invest unless you’re prepared to lose all the money you invest. This is a high-risk investment and you are unlikely to be protected if something goes wrong. Take 2 minutes to learn more
The bullish recovery of $SPONGE appears to have encountered resistance upon reaching the $0.000095 level, which suggests a potential consolidation phase around the $0.0000941 price point. This consolidation aims to establish a strong support base before the market can resume its bullish trajectory.
Key Price Levels
- Resistance: $0.000115, $0.000120, and $0.000125.
- Support: $0.000090, $0.000080, and $0.000085.
$SPONGE (SPONGE/USD) Price Analysis: Technical Insights
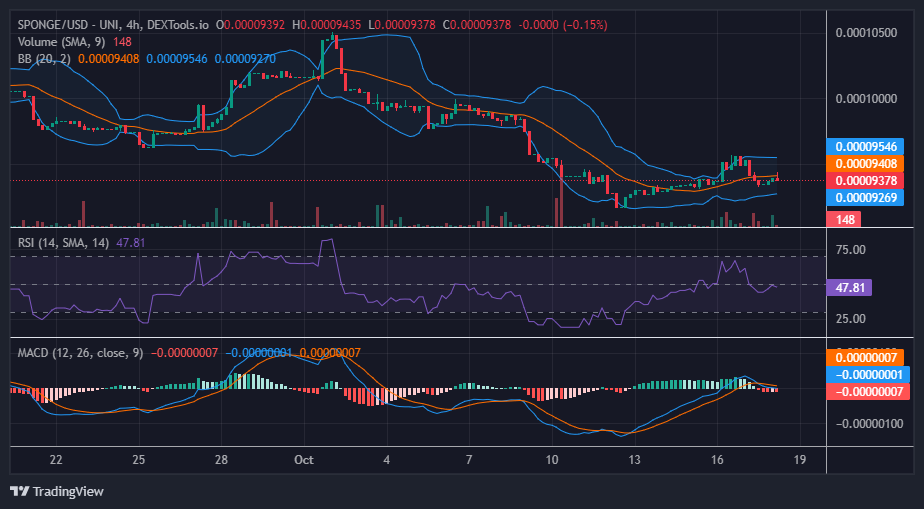
Following the price rejection at $0.00095, the Bollinger Bands indicator indicates an eastward movement in the market. Currently, $SPONGE price action closely aligns with the 20-day moving average, while the Relative Strength Index hovers around the midpoint level of 50. Additionally, in the Moving Average Convergence and Divergence (MACD), both the histograms and the MACD lines appear to be converging near the zero level. These factors collectively suggest the potential for price consolidation at the current level.
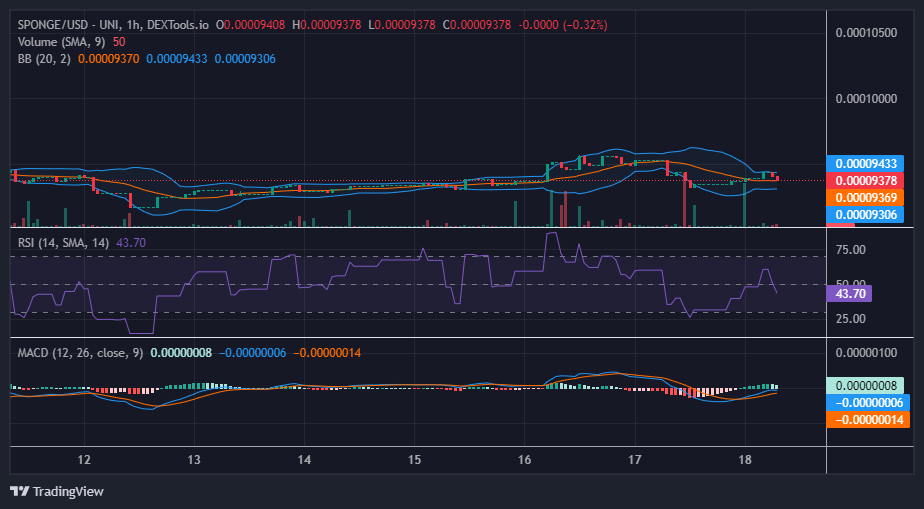
SPONGE/USD Short-Term Market Outlook: 1-Hour Chart
Much like the 4-hour chart’s market outlook, the Bollinger Bands indicator is currently establishing a horizontal channel with a bandwidth ranging from $0.0000943 to $0.0000930. A state of equilibrium has emerged around the $0.00009378 level, with bullish and bearish forces in a deadlock. The Relative Strength Index (RSI) also indicates a position near the midpoint, albeit with a slightly stronger bearish bias, thereby exerting pressure on the bullish stance. As this tug-of-war continues to evolve, there may be potential for a substantial price rally once the impasse reaches its climax.
Before entries end on October 30th, reserve your position in the first season of Sponge Airdrop!
🚀Calling all #SPONGERS! 🧽🌊
Secure your spot in the Sponge Airdrop Season 1 before entries close on October 30th! 👀
Get more info in our ‘Airdrop Sign-Up’ Discord channel!https://t.co/lzRhjW4oLL#SPONGE #Web3 #Crypto #Alts pic.twitter.com/RRn54rZDho
— $SPONGE (@spongeoneth) October 18, 2023
Invest in the hottest and best meme coin. Buy Sponge ($SPONGE) today!