SPONGE ($SPONGE) Holds Above Key Resistance, Eyes Further Upside Potential
Estimated Reading Time: 3 minutes
Don’t invest unless you’re prepared to lose all the money you invest. This is a high-risk investment and you are unlikely to be protected if something goes wrong. Take 2 minutes to learn more

In a promising development for bullish traders, SPONGE/USD ($SPONGE) has broken above the critical $0.00011 resistance level. More importantly, the price continues to consolidate above this key threshold, signaling strong bullish momentum.
This sustained price action reflects the resilience of the bulls as they aim to maintain upward pressure and explore the possibility of a continued breakout toward higher price levels.
Key Technical Levels
- Resistance: $0.000115, $0.000120, $0.000130
- Support: $0.000090, $0.000085, $0.000080
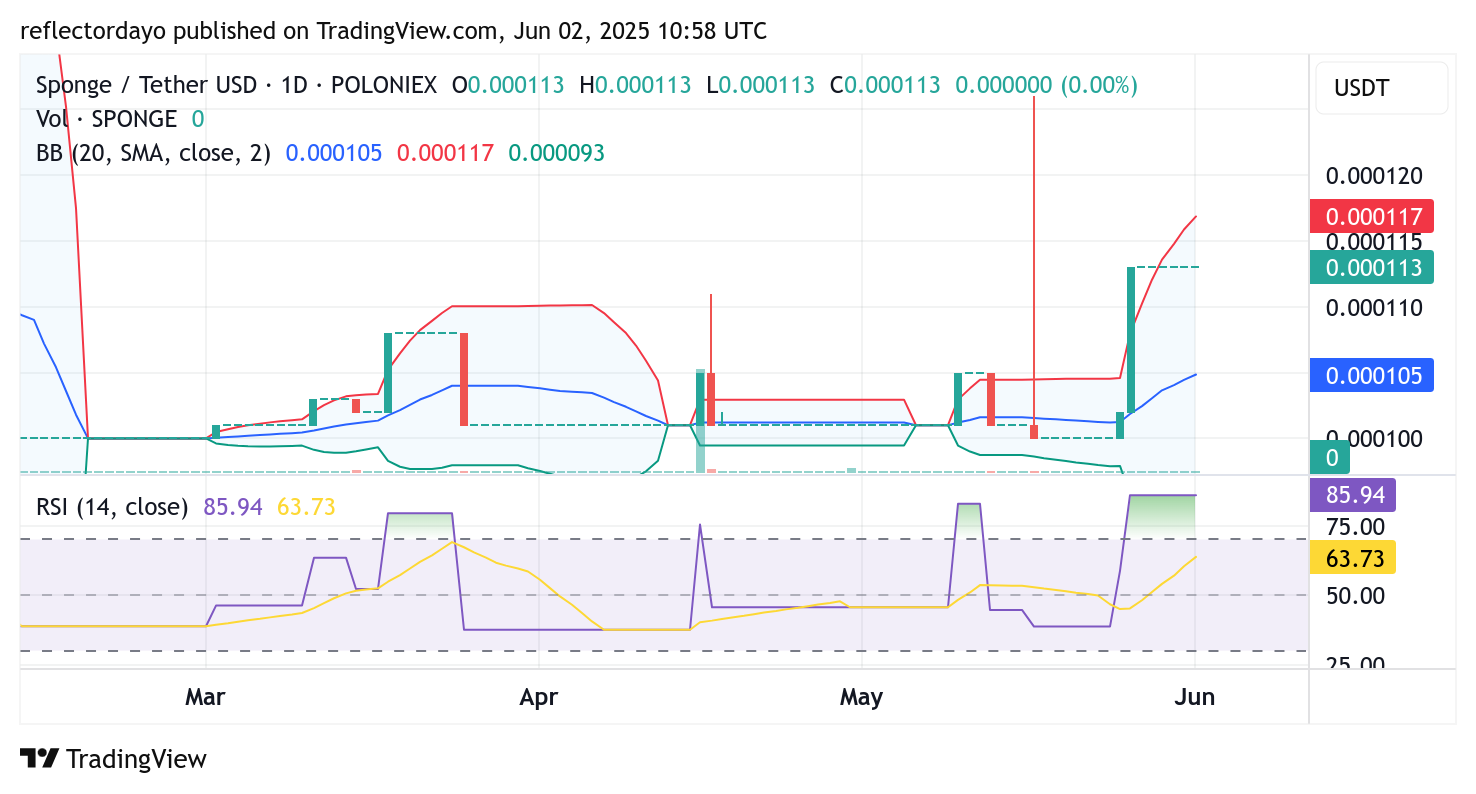
SPONGE/USD Daily Chart: What the Indicators Are Revealing
Previously, a breakout triggered a significant surge in market volatility. However, on lower timeframes, volatility has declined sharply as bulls and bears remain in a standoff. Despite this, the Bollinger Bands on the daily chart continue to show wide bandwidths—an indication that the market remains highly volatile.
The resilience of buyers is evident, as optimistic traders have kept the market buoyant. Technical indicators also suggest that, following the recent price rally, SPONGE/USD has entered overbought territory. This crypto signal typically signals a potential for a mild price correction.
Nonetheless, if bulls capitalize on the recent upward momentum, they may be able to establish a higher support level, potentially setting the stage for the next leg up in the market’s direction.
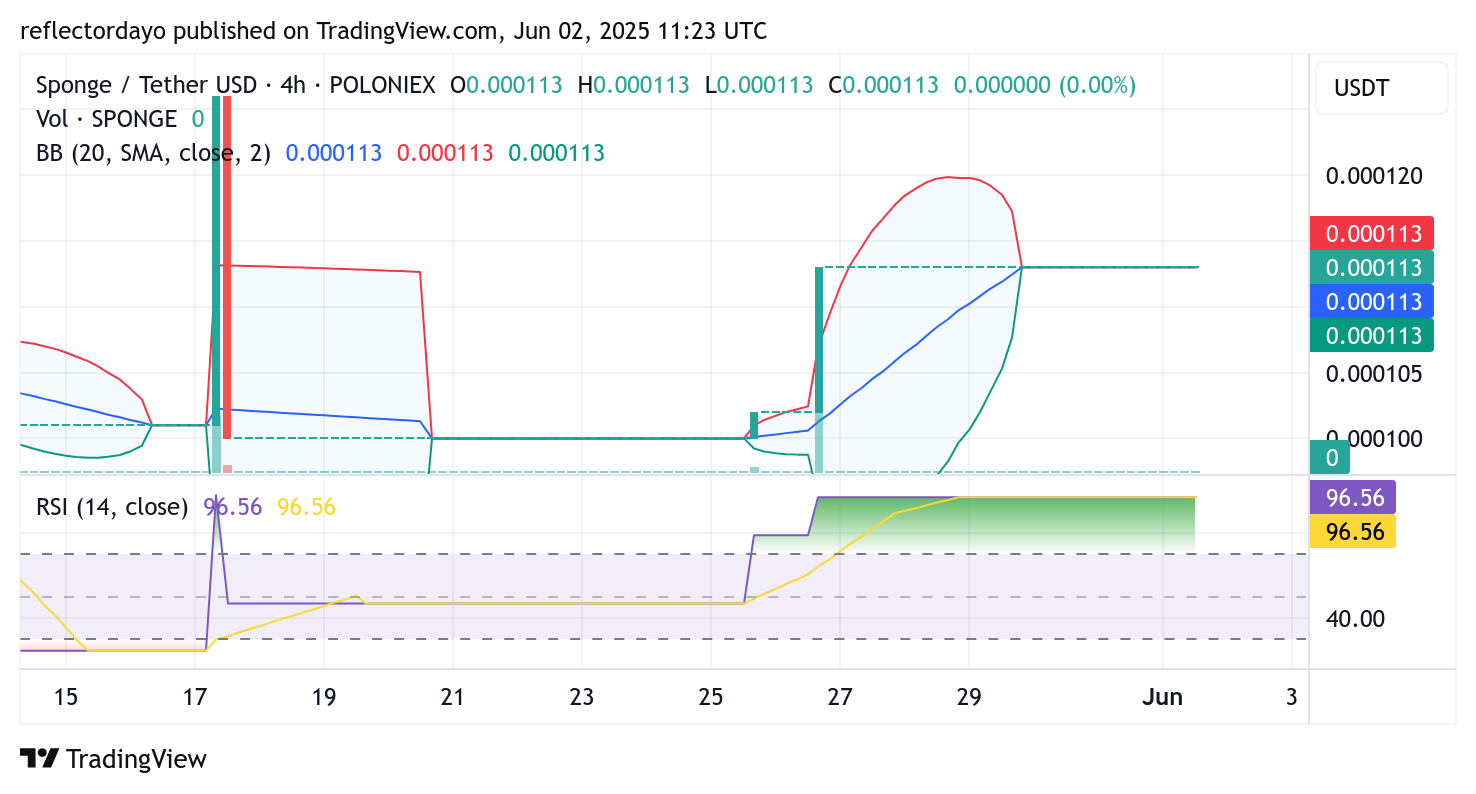
SPONGE/USD 4-Hour Chart: Volatility Compression Signals Imminent Move
While the daily chart indicates that SPONGE/USD remains highly volatile—evidenced by the wide Bollinger Band width—the 4-hour chart presents a different picture. From this shorter timeframe perspective, we observe a tightening of the Bollinger Bands, suggesting that the market is primed for a significant and clear directional move in the upcoming trading sessions.
Supporting this outlook, the Relative Strength Index (RSI) currently stands at an elevated level around 96, reflecting extremely strong bullish momentum. While this overbought condition hints at a possible price correction, it’s also likely that bulls could re-enter at a higher support level, reinforcing the market’s upward structure.
Buy $SPONGE!
The average IQ of a no-coiner pic.twitter.com/gh4H8sTdTI
— $SPONGE (@spongeoneth) June 1, 2025
Join the SPONGE community and get in on the next big crypto opportunity! Buy Sponge ($SPONGE) today