SPONGE ($SPONGE) Tests Crucial $0.00011 Threshold as Bulls Dig In
Estimated Reading Time: 3 minutes
Don’t invest unless you’re prepared to lose all the money you invest. This is a high-risk investment and you are unlikely to be protected if something goes wrong. Take 2 minutes to learn more

The $SPONGE market continues to show resilience, firmly holding above the $0.0001 support level. This sustained strength signals a clear bullish intent, with the price currently testing the $0.00011 mark. This action indicates growing buyer interest and hints at the potential for further upside.
The ongoing price consolidation just above $0.0001 suggests SPONGE might be establishing a new, robust support zone. If successful, this could provide a solid base for an accelerated bullish breakout in the near term.
Key Technical Levels
- Resistance: $0.000110, $0.000120, $0.000130
- Support: $0.000090, $0.000085, $0.000080
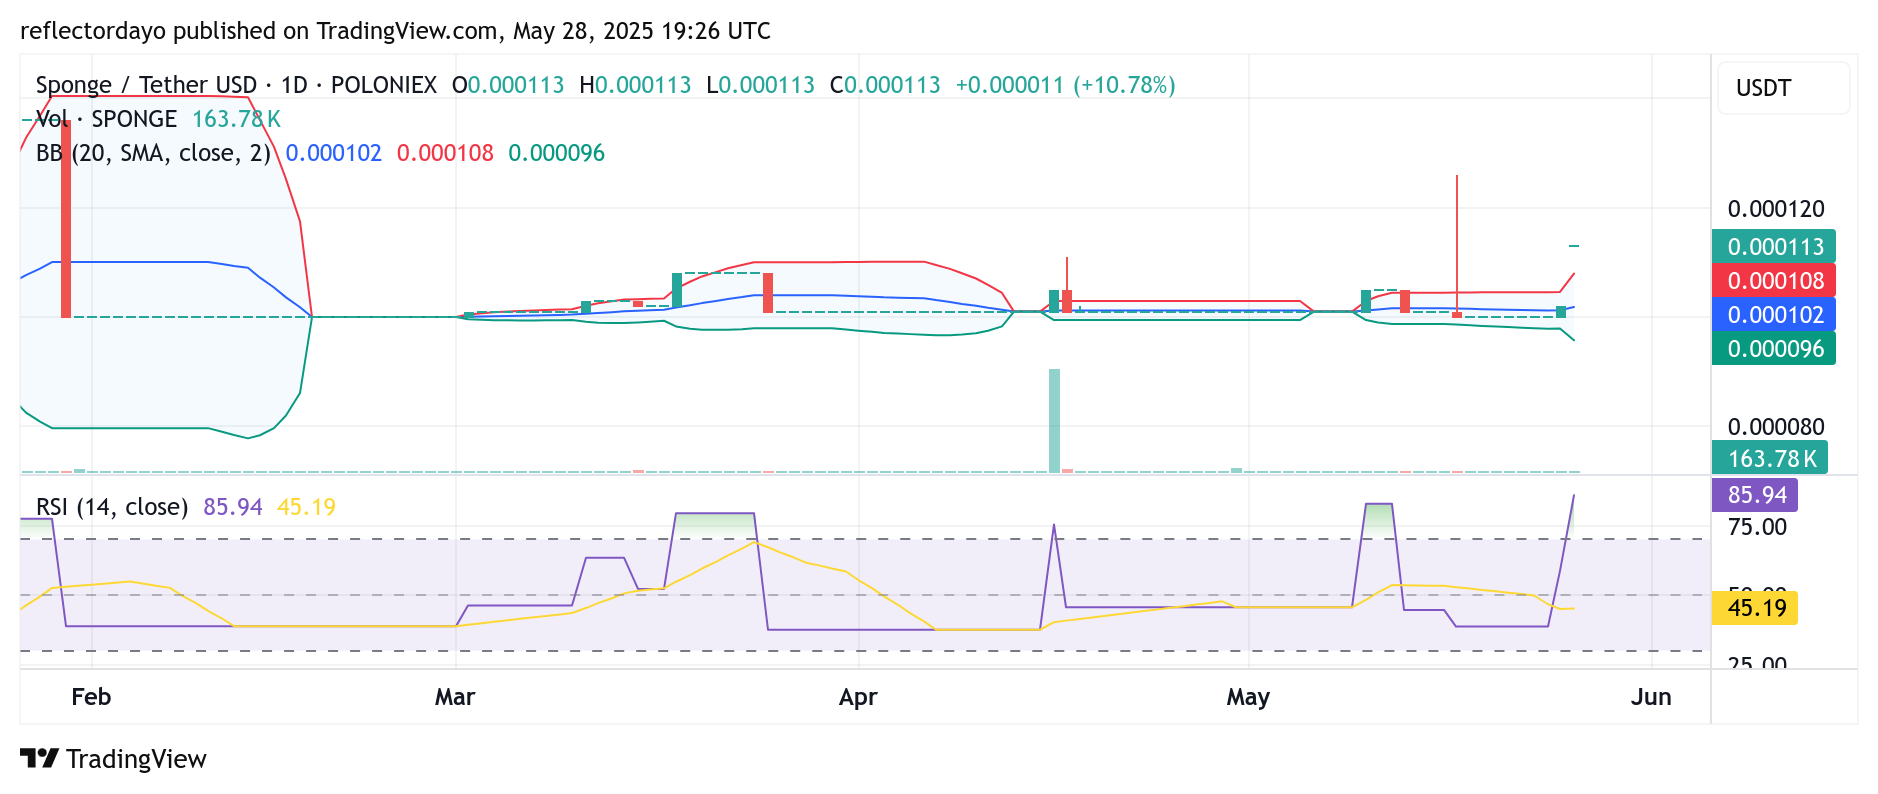
$SPONGE Daily Chart: Indecision at Resistance as Volume Lags
On the daily chart, $SPONGE has made a notable climb, pushing sharply to the $0.00011 level in the current session. However, market activity has paused at this key resistance, with buying and selling pressure appearing evenly matched. This is clearly depicted by the formation of a four-price doji candlestick, a classic signal of market indecision.
While the Bollinger Bands are widening, suggesting heightened volatility and a potential for significant movement, the trading volume remains relatively low. This discrepancy points to the possibility that the current bullish momentum is being driven by a limited number of participants rather than broad market conviction. A stronger breakout in upcoming sessions will likely depend on whether this early bullish activity manages to draw in wider trader participation.

4-Hour Chart: Volume Confirms Strength, But Overbought Signals Caution
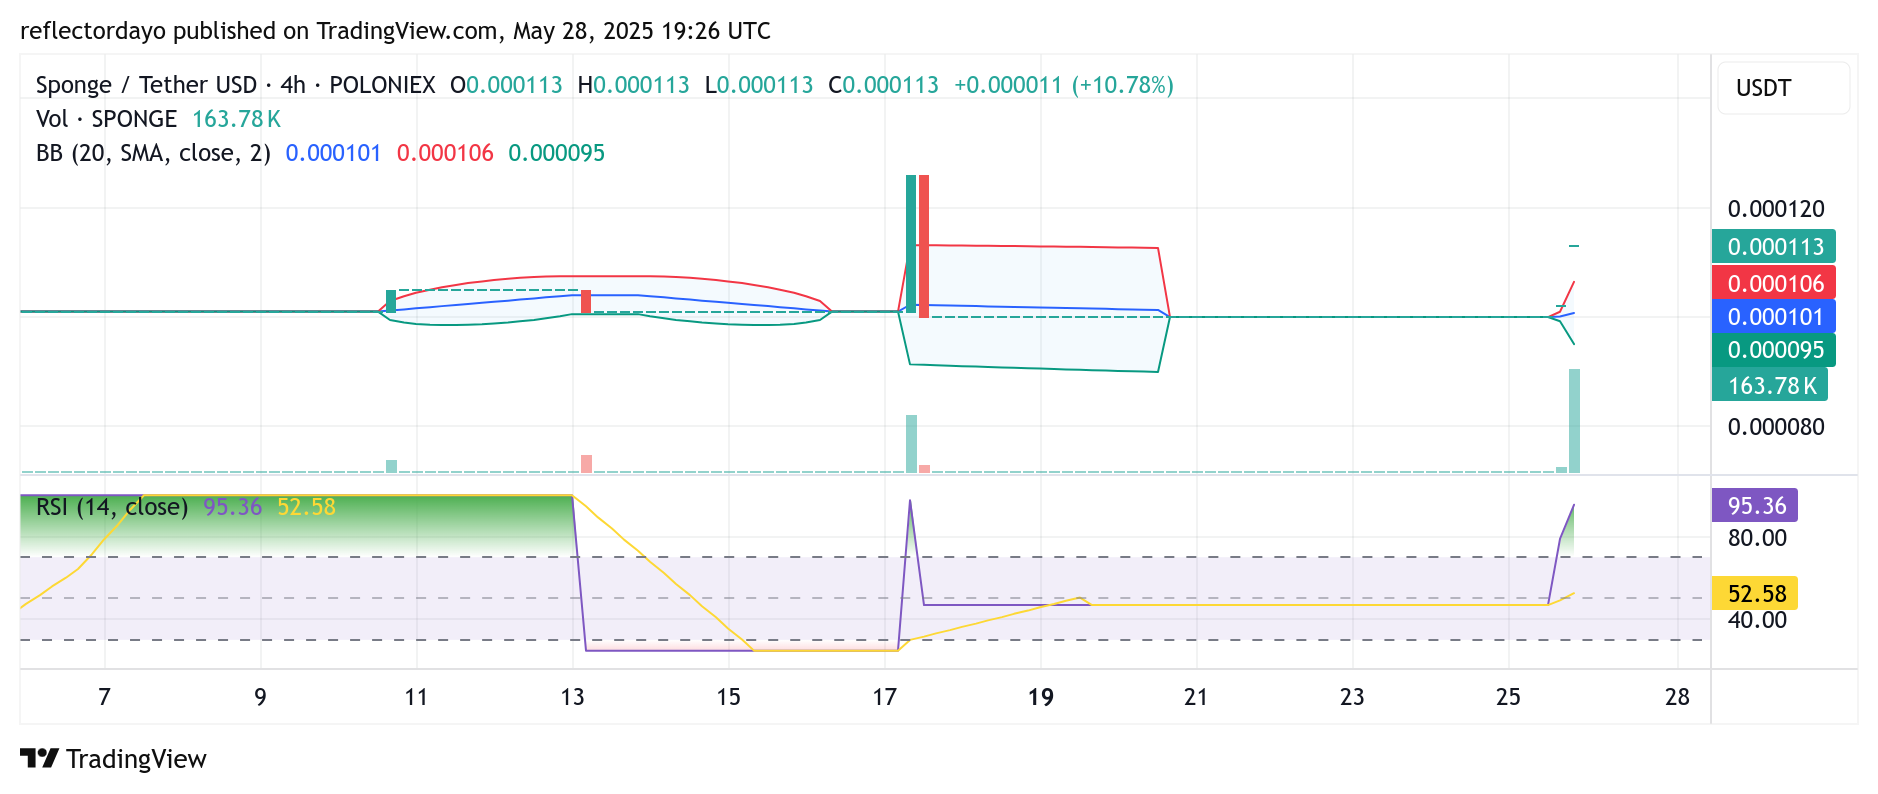
A closer look at the 4-hour chart reveals an encouraging surge in trading volume, clearly visible on the histogram. This robust increase in buying activity validates the emerging bullish trend, adding credibility to SPONGE’s upward movement.
However, several technical indicators are now flashing overbought conditions. This suggests that while the bullish momentum is strong, the market may be ripe for a short-term pullback. Such a brief correction could be beneficial, allowing the asset to consolidate and establish a higher support level before resuming its rally. Traders should remain watchful, as this consolidation might simply be a pause before the next leg up.
Sometimes it doesn’t need to make sense 🧽💦 pic.twitter.com/yxivHq5t30
— $SPONGE (@spongeoneth) May 26, 2025
Join the SPONGE community and get in on the next big crypto opportunity! Buy Sponge ($SPONGE) today