$SPONGE (SPONGE/USD) at a Crossroads: Bulls vs. Bears
Estimated Reading Time: 3 minutes
Don’t invest unless you’re prepared to lose all the money you invest. This is a high-risk investment and you are unlikely to be protected if something goes wrong. Take 2 minutes to learn more

The $SPONGE market is at a critical juncture, with bulls and bears locked in a struggle for control. While currently trading around $0.000023, the price is hovering near the crucial $0.000024 support level. This level has repeatedly acted as a significant battleground, halting previous bearish advances and triggering multiple upward price tests, indicating a strong bullish defense. Although recent price action suggests intensifying bearish pressure, the historical resilience of this support zone hints at the potential for a buyer resurgence. The $0.000024 mark has historically been a pivotal point for SPONGE, and whether it holds or breaks will likely determine the cryptocurrency’s near-term trajectory.
Key Market Dynamics:
- Resistance Levels: $0.00005, $0.000055, $0.000060
- Support Levels: $0.000020, $0.0000195, $0.000019

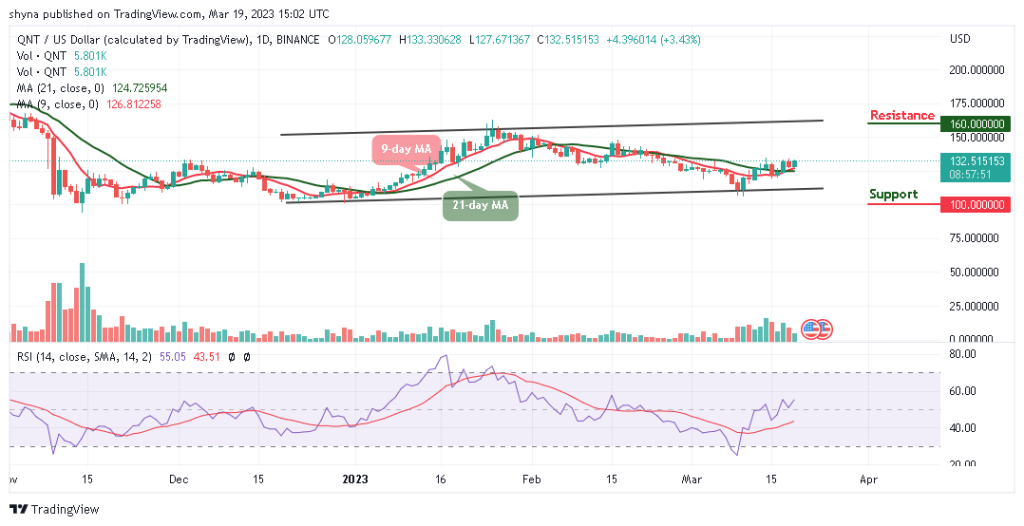
$SPONGE (SPONGE/USD) Technical Analysis
From a technical perspective, $SPONGE appears to be entering a period of heightened volatility. Following a period of consolidation around $0.000024, characterized by a “volatility squeeze” indicated by narrowing Bollinger Bands, a breakout appears to be underway. However, the direction of this breakout remains uncertain. While bears have demonstrated initial strength, they may encounter significant support at the $0.000020 level, potentially limiting further downside. Key support levels to monitor include $0.000020 and $0.000015. Should the bearish trend persist, a potential rebound could occur around these levels due to existing bullish sentiment, potentially driving the price back towards $0.000035.

$SPONGE (SPONGE/USD) 1-Hour Chart Observations
On the 1-hour chart, SPONGE recently pulled back from $0.000026 to around $0.000023, near the key $0.000024 support level. Despite the seemingly strong bearish move, buyers have thus far defended this level. The relatively low selling volume suggests a potential rebound in the next trading session. The bullish sentiment surrounding the $0.000024 support makes a bounce from this level a distinct possibility. Traders should closely observe price action around this level to confirm whether the bearish trend will continue or if a bullish reversal is imminent.
Buy SPONGE/USD!
This is Jim.
Don’t be like Jim. pic.twitter.com/tnEoJ9MUwf— $SPONGE (@spongeoneth) January 24, 2025
Join the SPONGE community and be part of the next big crypto sensation! Buy Sponge ($SPONGE) today!