$SPONGE (SPONGE/USD): Bulls Gather at $0.00004 for a Breakout Attempt
Estimated Reading Time: 3 minutes
Don’t invest unless you’re prepared to lose all the money you invest. This is a high-risk investment and you are unlikely to be protected if something goes wrong. Take 2 minutes to learn more

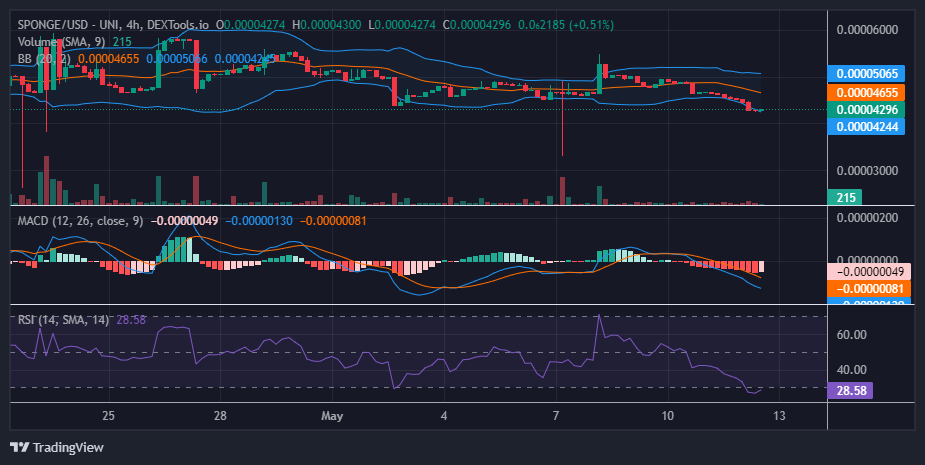
The ongoing market activity in the $SPONGE pair, particularly within the $0.00004 to $0.00005 price range, continues to witness a notable tug-of-war between bearish and bullish forces. This dynamic originated from a significant downturn instigated by bears, precipitating a sharp decline from the $0.00005 to $0.000045 and then finally to the $0.00004 threshold. However, bullish support emerged around the $0.00004 mark, effectively halting further descent. Recent observations of the crypto signal from the chart suggest a waning bearish momentum, hinting at a potential shift towards bullish price momentum in the near future.
Key Market Dynamics:
- Resistance Levels: $0.0010, $0.0011, and $0.0012.
- Support Levels: $0.000035, $0.000030, and $0.000025.
Delving into Technical Analysis for $SPONGE (SPONGE/USD)
For a while now, the market has been consolidating within the midrange of the price channel, spanning from $0.00004 to $0.00005. This pattern typically reflects a state of indecision or equilibrium between demand and supply in the $SPONGE market. Despite the Moving Average Convergence and Divergence (MACD) indicator signaling bearish sentiments, recent market developments suggest a potential shift towards bullish momentum.
While the MACD has consistently displayed negative histograms, the latest histogram indicates a fading red color, signaling a possible exhaustion of bearish pressure. This observation is indicative of a potential reversal. Furthermore, it’s noteworthy that the Relative Strength Index (RSI) is currently moving into oversold territory. Such a movement often precedes a corrective phase, which, when coupled with anticipated bullish momentum, could lead to a significant upward movement.

Insights from the 1-Hour Perspective:
Upon analyzing the Moving Average Convergence and Divergence (MACD) indicator within this timeframe, a burgeoning bullish trend becomes evident. Notable observations include the presence of a fading red histogram with diminishing heights, alongside the imminent crossover of the MACD line over the MACD signal line, signaling a transition from bearish to bullish momentum.
Furthermore, as the market approaches the $0.00004 price level, bullish strength is becoming apparent. Consequently, there’s a possibility of a bounce occurring at this juncture.
Buy SPONGE/USD!
You know how it is 🧽 🧽 🧽 $SPONGE #PEPE #BONK #DOGE pic.twitter.com/bxCXbzyehb
— $SPONGE (@spongeoneth) May 12, 2024
Invest in the hottest and best meme coin. Buy Sponge ($SPONGE) today!