Lucky Block Price Prediction: LBLOCK/USD Gets Ready for a Bullish Breakout Above $0.0020
Estimated Reading Time: 3 minutes
Don’t invest unless you’re prepared to lose all the money you invest. This is a high-risk investment and you are unlikely to be protected if something goes wrong. Take 2 minutes to learn more

Free Crypto Signals Channel
The daily chart reveals that if the price shoot to the upside, the Lucky Block price prediction would rise towards the previous high.
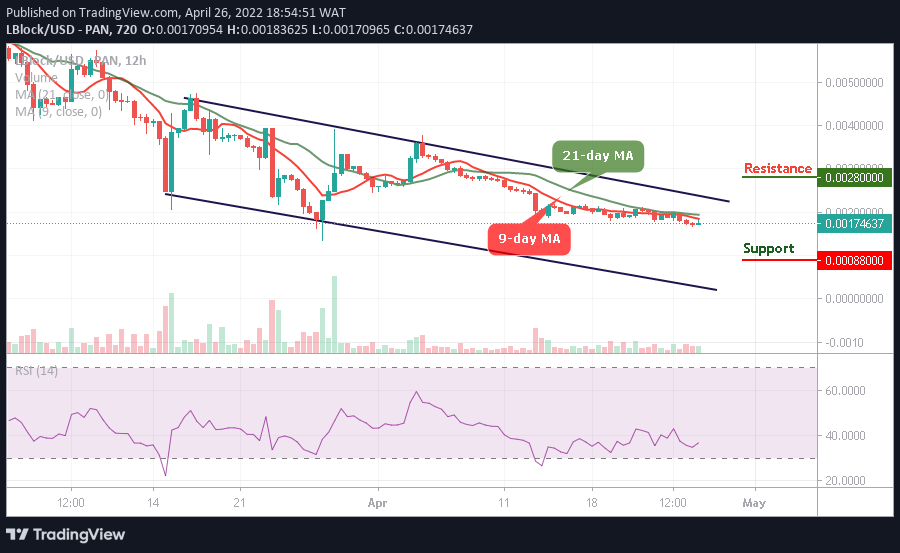
LBLOCK/USD Medium-term Trend: Bearish (12H Chart)
Key Levels:
Resistance levels: $0.0028, $0.0030, $0.0032
Support levels: $0.0008, $0.0006, $0.0004
At the time of writing, LBLOCK/USD is ranging as the market price prepares to cross above the 9-day and 21-day moving averages. Meanwhile, the prices are becoming cheaper and cheaper for new buyers to come into the market while the existing buyers are expected to buy the dips.
Lucky Block Price Prediction: Where Would LBLOCK/USD Go Next?
The Lucky Block price is changing hands at $0.0017 where it prepares to cross above the 9-day and 21-day moving averages. However, if the coin continues the upward movement, the coin may locate the potential resistance levels at $0.0028, $0.0030, and $0.0032, while the support levels could be located at $0.0008, $0.0006, and $0.0004 as the technical indicator Relative Strength Index (14) moves to cross above 40-level.
LBLOCK/USD Medium-term Trend: Bearish (4H Chart)
On the 4-hour chart, the Lucky Block price stays above the 9-day moving average but is yet to get to the 21-day MA. However, the technical indicator Relative Strength Index (14) is likely to cross above the 40-level to push the coin to the upside. Meanwhile, any further bullish movement towards the upper boundary of the channel could hit the resistance level at $0.0020 and above.
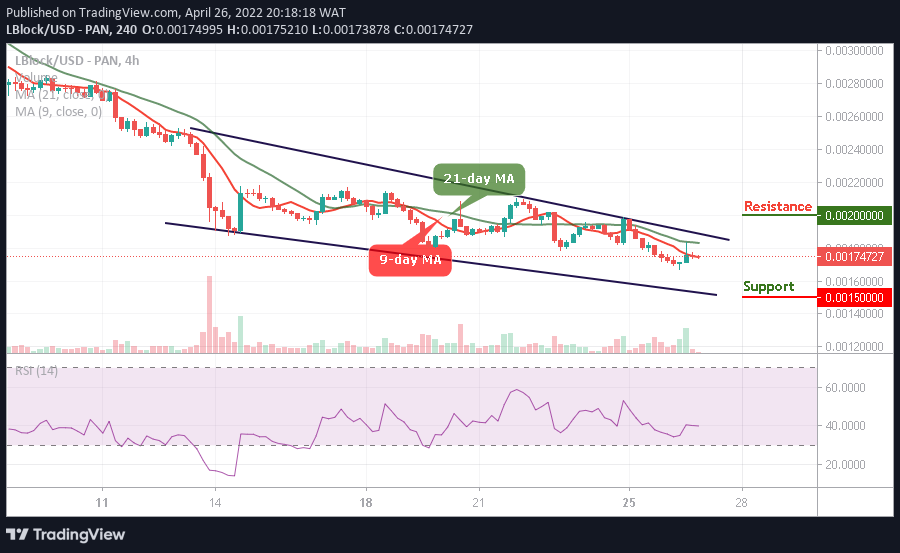
On the contrary, LBLOCK/USD needs to experience bullish signals, and once this happens, the market price may keep moving above the moving averages, but if the price drops below the market value at $0.0017, it could touch the critical support at $0.0015 and below. The technical indicator Relative Strength Index (14) reveals that the market is ready to spike as the signal line gets ready to cross above the 40-level.
Read more: