$SPONGE (SPONGE/USD) Bulls Gather Momentum at $0.000055, Primed for Upside Rally
Estimated Reading Time: 3 minutes
Don’t invest unless you’re prepared to lose all the money you invest. This is a high-risk investment and you are unlikely to be protected if something goes wrong. Take 2 minutes to learn more

In the recent $SPONGE price analysis, it was observed that the market exhibited resilience around the $0.00005 price level while advancing towards $0.00006. However, subsequent to nearing the $0.00006 threshold, signs of resistance emerged. Presently, there is evidence of bullish activity, notably at an elevated support level of $0.000055. This development suggests a favorable outlook for continued bullish momentum, with the $0.000055 support level likely to serve as a catalyst for further upward movement in the market.
Key Market Dynamics:
- Resistance Levels: $0.0010, $0.0011, and $0.0012.
- Support Levels: $0.000035, $0.000030, and $0.000025.
Delving into Technical Analysis for $SPONGE (SPONGE/USD):
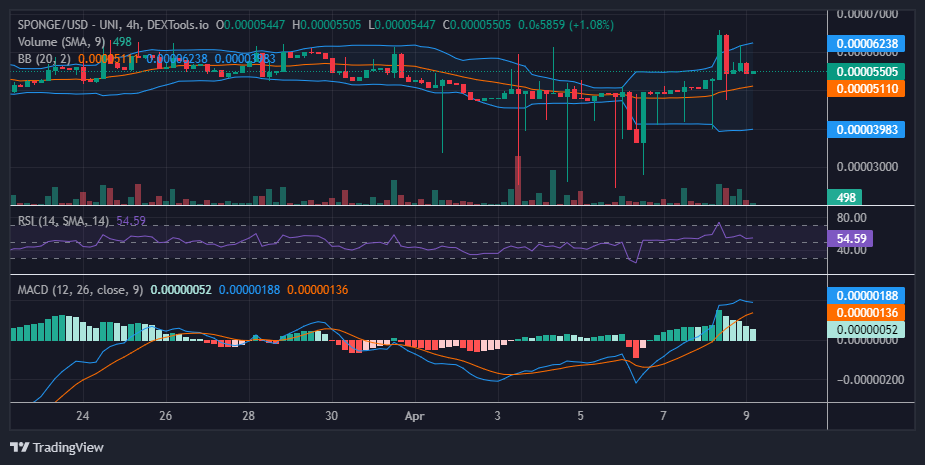
In our recent $SPONGE analysis, we observed a gradual divergence in price action from the prolonged standoff at the pivotal $0.00005 level, with an upward trend emerging toward $0.00006. This upward movement triggered an escalation in market volatility. However, this heightened volatility has bolstered bearish sentiment, particularly evident at the critical resistance level of $0.00006. Consequently, the market has retreated from this level, with bullish activity now apparent around the $0.000055 mark.
The Moving Average Convergence and Divergence (MACD) indicator indicates waning bullish momentum. There is a possibility of a consolidation phase around $0.000055. However, should consolidation fail to materialize, the market may regain bullish momentum around $0.00005.
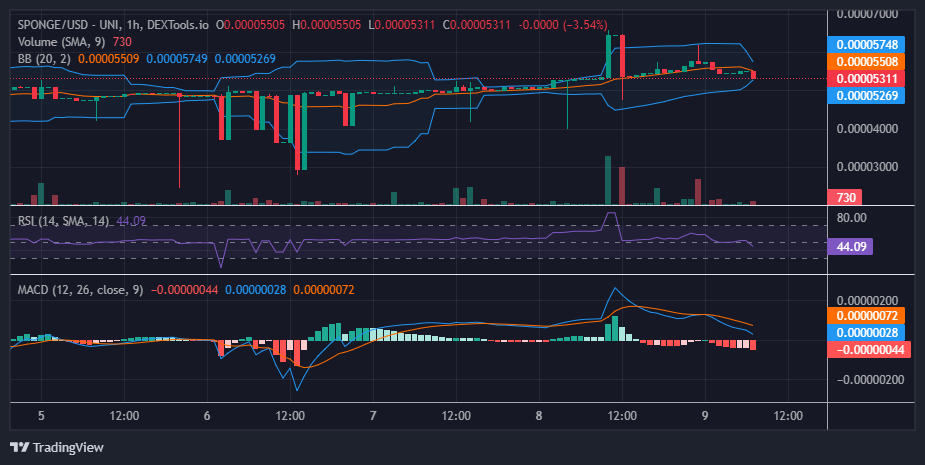
Insights from the 1-Hour Perspective:
During a period of approximately four 1-hour trading sessions, the market exhibited minimal movement around the $0.000055 price level, coinciding with a notable convergence of the Bollinger Bands indicator. Such convergence often signals an imminent price movement. Despite this, a bearish candlestick pattern emerged, potentially indicating a short-term downward trend. However, this downward movement could potentially catalyze a robust bullish response as the market approaches the $0.00005 price threshold.
Buy SPONGE/USD!
Did you miss another 100x, anon? 💦$SPONGE #SpongeV2 #Alts #100x pic.twitter.com/6WSh6BcaMT
— $SPONGE (@spongeoneth) April 9, 2024
Invest in the hottest and best meme coin. Buy Sponge ($SPONGE) today!