$SPONGE (SPONGE/USD) Finds Support at $0.00053, Bullish Momentum to Soon Surge
Estimated Reading Time: 3 minutes
Don’t invest unless you’re prepared to lose all the money you invest. This is a high-risk investment and you are unlikely to be protected if something goes wrong. Take 2 minutes to learn more

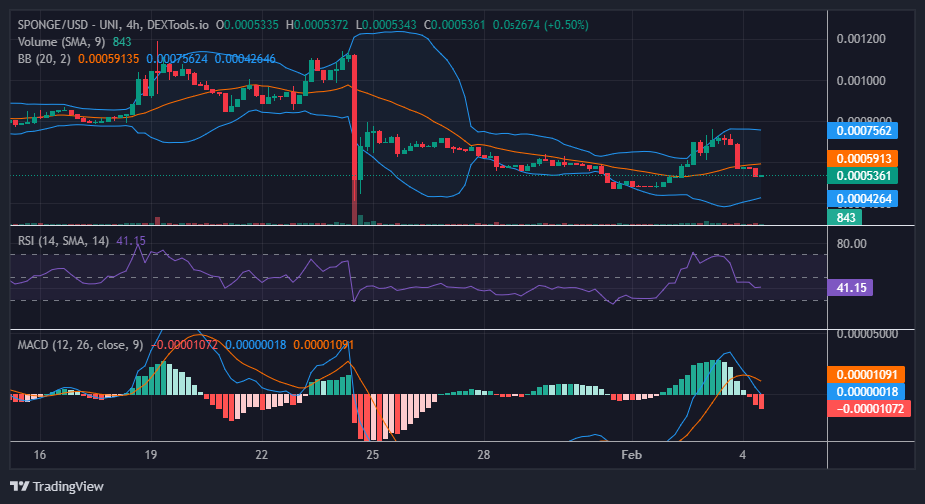
The recent bullish surge reached its pinnacle, surpassing the $0.00077 price level, initiating a subsequent bearish SPONGE/USD market trend. Initially, a robust bearish price movement led to a decline towards the 20-day moving average, stabilizing around the $0.000576 support level. Despite attempts by bulls to withstand the bearish pressure, a reevaluation is necessitated, settling at $0.00052. There is potential for a resurgence in the price at this level.
Key Market Dynamics:
- Resistance Levels: $0.0010, $0.0011, and $0.0012.
- Support Levels: $0.00040, $0.00035, and $0.00030.
Comprehensive Technical Analysis for $SPONGE (SPONGE/USD)
The SPONGE/USD bear market gained momentum, originating from the $0.0007 price level, leading to a substantial decline to $0.00057. At this juncture, the Moving Average Convergence and Divergence (MACD) indicator displayed a bearish crossover, accompanied by notable negative histograms. Despite these pronounced bearish signals, indications from the chart suggest a potential resistance to the current downward trend.
Adding weight to this observation is the Relative Strength Index (RSI), which maintains a momentum measurement of 41. This crypto signal implies that the market may have established support at $0.00052, prompting a rebound in prices. This could present an opportune moment for strategic buying.
Insights from the 1-Hour Perspective:
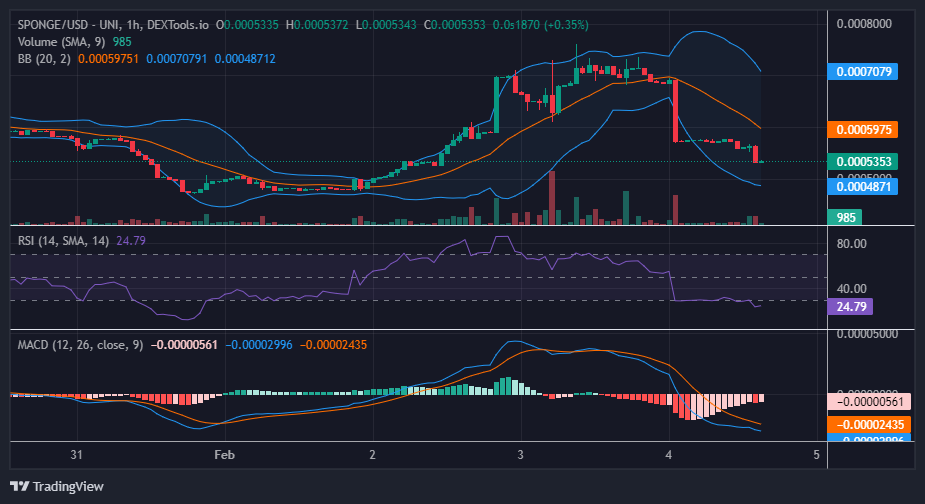
Despite the strength of the bearish signal, it is evident that the bulls are displaying resilience in their efforts to reverse the market trend. Both the Relative Strength Index (RSI) and the Moving Average Convergence and Divergence (MACD) indicators indicate weakening bearish conditions. The market’s momentum is now approaching the oversold region threshold, and the MACD histograms have faded, signifying a diminishing bearish momentum. This suggests an impending price rally.
Get your $SPONGE tokens staked quickly before the #SPONGE V1 is decommissioned!
#SpongeV2 about to melt faces… 🧽
Hurry and stake your $SPONGE tokens before #SPONGE V1 is discontinued! 🚨
⏰ February 5th at 11PM UTC
Stake your tokens now on our website to ensure a smooth transition!#AbsorbTheDamp #MemeCoin #100x #AltSeason #Crypto pic.twitter.com/j6CptXZKRO
— $SPONGE (@spongeoneth) February 4, 2024
Invest in the hottest and best meme coin. Buy Sponge ($SPONGE) today!