$SPONGE (SPONGE/USD) Holds Firm at $0.00004 Support
Estimated Reading Time: 3 minutes
Don’t invest unless you’re prepared to lose all the money you invest. This is a high-risk investment and you are unlikely to be protected if something goes wrong. Take 2 minutes to learn more

As volatility in the $SPONGE market persists, bulls are retreating toward the $0.00004 price level. Previous market analysis highlighted strong bearish activity between the $0.000055 and $0.00006 ranges, limiting price swings as bearish forces continued to reject upward movement within this zone. Most significant price swings occurred below this range before the $0.00004 support level emerged, which remains strong in the market.
Key Market Dynamics:
- Resistance Levels: $0.0010, $0.0011, and $0.0012.
- Support Levels: $0.000035, $0.000030, and $0.000025.
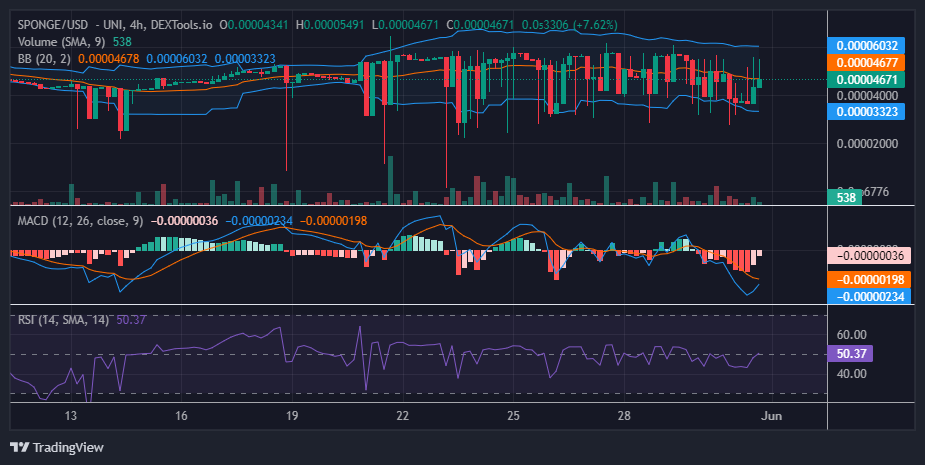
Delving into Technical Analysis for $SPONGE (SPONGE/USD)
The $SPONGE bulls remain steadfast in maintaining the $0.00004 support level, despite increased bearish pressure causing a slight dip. The price action is testing below $0.00004, but this is not seen as a significant threat. The market shows signs of volatility, and pressure may soon push prices back to the $0.000055 level. The Moving Average Convergence and Divergence (MACD) indicator reveals building bullish momentum, with the negative histogram turning pale and a bullish crossover imminent below the zero level. These factors indicate a brewing bullish momentum ready to launch.
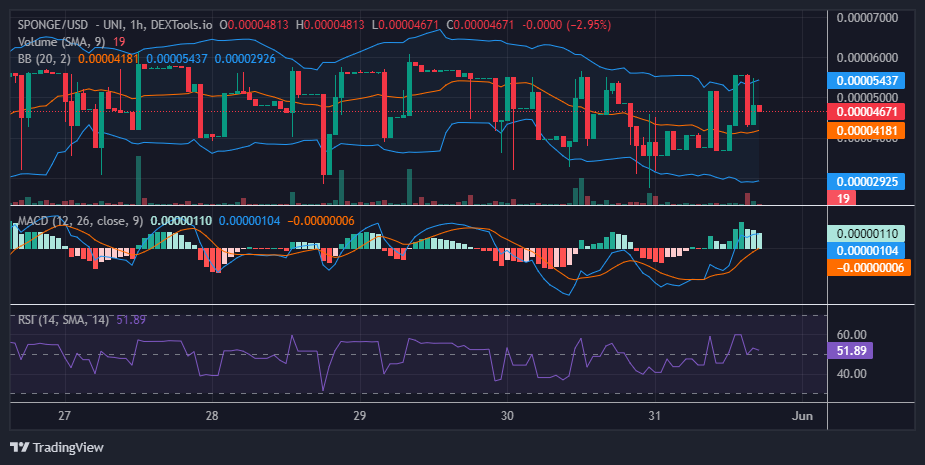
Insights from the 1-Hour Perspective
The 1-hour chart currently indicates bearish activity, with the price retracing downward. However, the price remains above the 20-day moving average, currently at $0.00004181, indicating that bulls still maintain control. Additionally, the Relative Strength Index (RSI) and the Moving Average Convergence and Divergence (MACD) indicators are in bullish zones. Despite the prevailing volatility, which makes it difficult to definitively determine who is in control, the bulls are showing signs of recovery.
This is the time you’ve been waiting for! To obtain your $SPONGE tokens, go to these instructions.
🧽 CLAIM IS LIVE, #SPONGERS! 🧽
The moment you’ve been waiting for is here! 🔥
Follow these steps to claim your $SPONGE tokens.1️⃣ Visit the staking page on our website
👉https://t.co/lPbuIoygqR2️⃣ Connect the same wallet you used for your purchase.
3️⃣ Claim your $SPONGE… pic.twitter.com/n5EjiUz6vw
— $SPONGE (@spongeoneth) May 30, 2024
Invest in the hottest and best meme coin. Buy Sponge ($SPONGE) today!