Wall Street Memes (WSM) Price Is Cool, Inputting Springs
Estimated Reading Time: 4 minutes
Don’t invest unless you’re prepared to lose all the money you invest. This is a high-risk investment and you are unlikely to be protected if something goes wrong. Take 2 minutes to learn more
Wall Street Memes Price Prediction – July 30
Based on an assessment of the base formation pattern in the pricing outlook involving bulls and bears in the WSM/USD trading pair, it appears that buyers are holding firmly against fear-driven pullbacks, given that the price is cooling and inputting springs.
The WSM/USD price is stabilizing around the $0.0007 zone, with candlestick patterns reflecting cooling momentum and early signs of market spring-loading. Stochastic oscillators are steadying, suggesting diminishing bearish pressure. Accumulation traits are quietly forming, indicating strategic long-term positioning. A breakout pulse may soon emerge from this foundational shift.
WSM/USD Market
Key Levels
Resistance levels: $0.0008, $0.0009, $0.001
Support levels: $0.0006, $0.0005, $0.0004
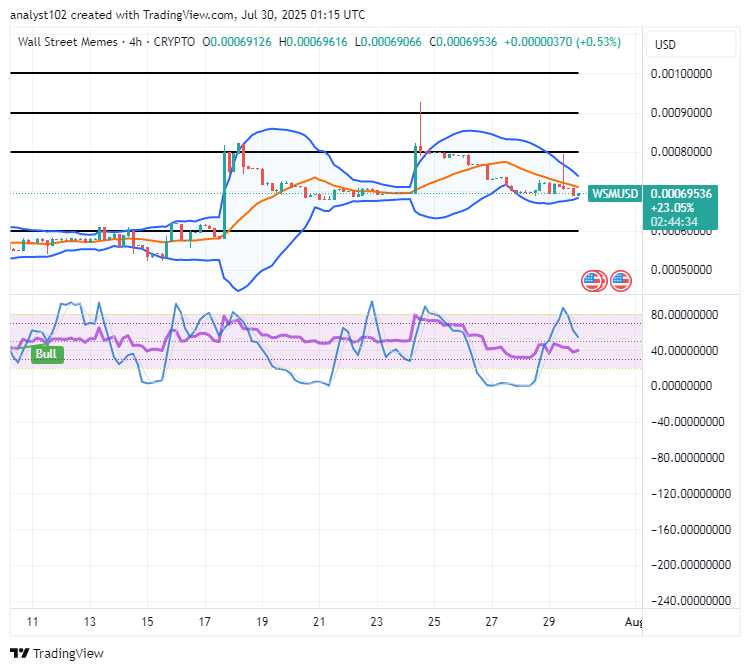
WSM/USD – 4-hour Chart
The medium-term chart of the WSM/USD trade, as of this piece, showcases the crypto-economic business is cool, inputting springs in its formation style around $0.0007.
The Bollinger Bands indicators are tactically positioned within a well-defined bullish pennant pattern, tightly confined between the trading levels of $0.0008 and $0.0006, indicating a potential volatility squeeze. The positioning of the stochastic oscillators shows an increasing tendency to signal a decisive positive repointing move from around the 40 zone, hinting at an impending upward momentum shift.
With WSM/USD Stabilizing Near $0.0007, Should Buyers Reinforce Positions in Anticipation of a Rebound?
The price stabilizing around $0.0007 may indicate the formation of a short-term support zone. If this level has held across multiple sessions with reduced volatility, it could signify seller exhaustion and establish a potential platform for a rebound, especially as the WSM/USD market appears to be cooling off and inputting springs..
WSM/USD’s cooling phase and spring-like buildup near $0.0007 suggest a maturing support base. Long-term buyers should maintain their positions, as this consolidation may precede a broader upward shift. Gradual accumulation could prove strategic as momentum slowly resets.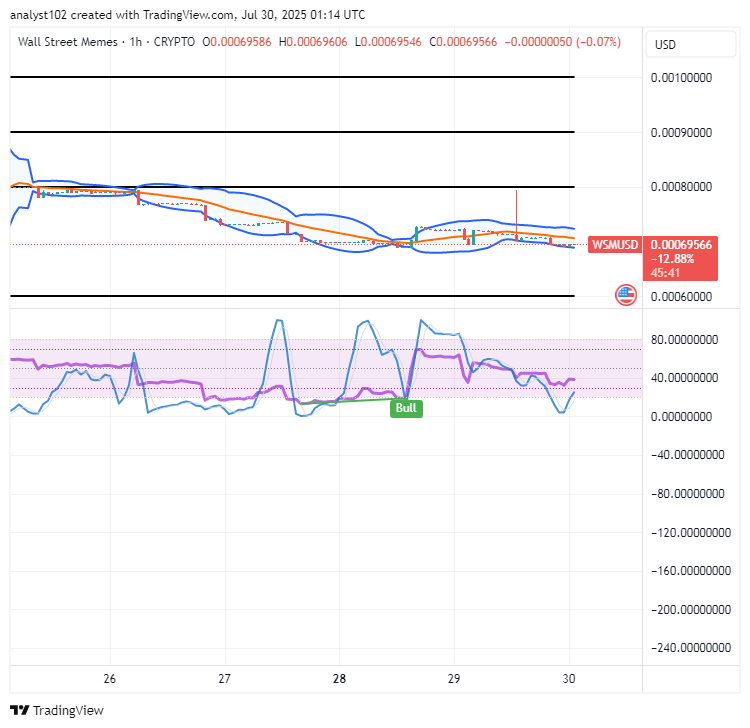
WSM/USD 1-hour chart
The 1-hour chart of the WSM/USD trade shows that the short-term crypto price is cool in its moving outlook, inputting springs.
The Stochastic Oscillators: Currently exhibiting gentle downward waves, yet still holding above bullish confirmation levels. This movement hints at a possible directional breakout, with momentum gathering just beneath the surface. The Bollinger Bands: Volatility is tightening around the $0.0007 region, forming a subtle bullish flag pattern. This steady consolidation may be laying the groundwork for a breakout, as price compression often precedes sharp movements.
🚀 BIGTIME/USDT & WSM/USDT Contracts Are Now Live on Bybit!
Explore fresh trading opportunities with 1–25x leverage on both pairs.
Now also available on Bybit Futures Grid Bot for automated trading strategies.
📈 Trade BIGTIME: https://i.bybit.com/20rabgrK
📈 Trade WSM: https://i.bybit.com/ab1F9gWH
Start trading with precision and flexibility today!
🚀 BIGTIMEUSDT & WSMUSDT Contracts now on Bybit!
— Bybit (@Bybit_Official) October 12, 2023
Dive into new trading opportunities with 1-25x leverage. Plus, they’re now on Bybit Futures Grid Bot! Start trading now.
📈 BIGTIME: https://t.co/FAQlbhnzAh
📈 WSM: https://t.co/pb2y2AfMBE#CryptoTrading #Bybit
Buy and stake WSM now! https://wallstmemes.com/