Lucky Block Price Prediction: LBLOCK/USD Will Spike Above $0.0027 Level
Estimated Reading Time: 2 minutes
Don’t invest unless you’re prepared to lose all the money you invest. This is a high-risk investment and you are unlikely to be protected if something goes wrong. Take 2 minutes to learn more

Free Crypto Signals Channel
According to the chart, the Lucky Block price prediction shows that LBLOCK would rise above the upper boundary of the channel.
LBLOCK/USD Medium-term Trend: Bullish (12H Chart)
Key Levels:
Resistance levels: $0.0035, $0.0037, $0.00439
Support levels: $0.0020, $0.0018, $0.0016
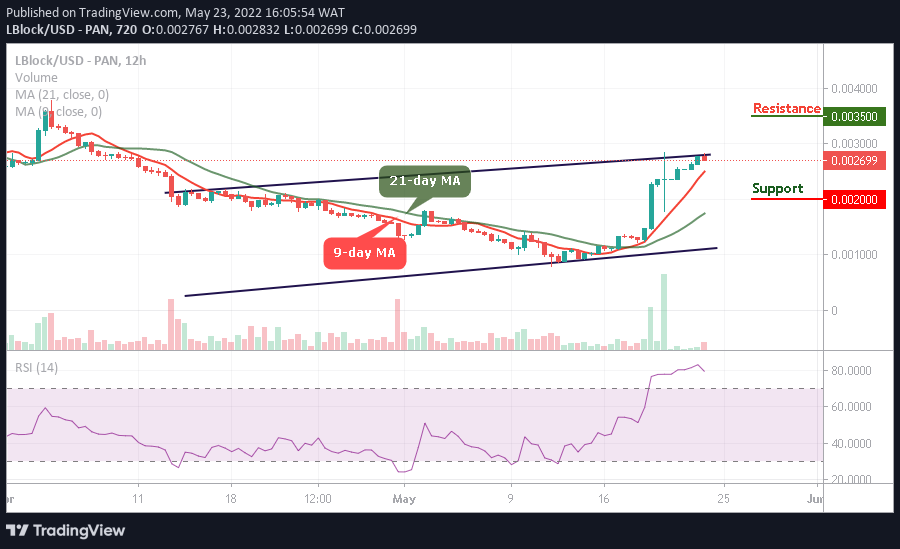
At the time of writing, LBLOCK/USD is attempting to cross above the upper boundary of the channel as the coin gets ready for additional upsides. Meanwhile, the bullish movement is ready to push the coin towards the resistance level of $0.0030.
Lucky Block Price Prediction: LBLOCK/USD Shows More Green Lights
The Lucky Block price is hovering at $0.0026 where it prepares to cross above the upper boundary of the channel. If the bulls continue to put more pressure, LBLOCK/USD will remain on the positive side; any further bullish movement will locate the potential resistance levels at $0.0035, $0.0037, and $0.0039.
On the contrary, any bearish movement below the 9-day and 21-day moving averages could locate the support levels at $0.0020, $0.0018, and $0.0016. Moreover, the technical indicator Relative Strength Index (14) remains within the overbought region, suggesting that more bullish signals will play out.
LBLOCK/USD Medium-term Trend: Bullish (4H Chart)
On the 4-hour chart, the Lucky Block price is consolidating above the 9-day and 21-day moving averages with a bullish candle. On the other hand, the technical indicator Relative Strength Index (14) remains within the overbought region keeping the coin at the upside.
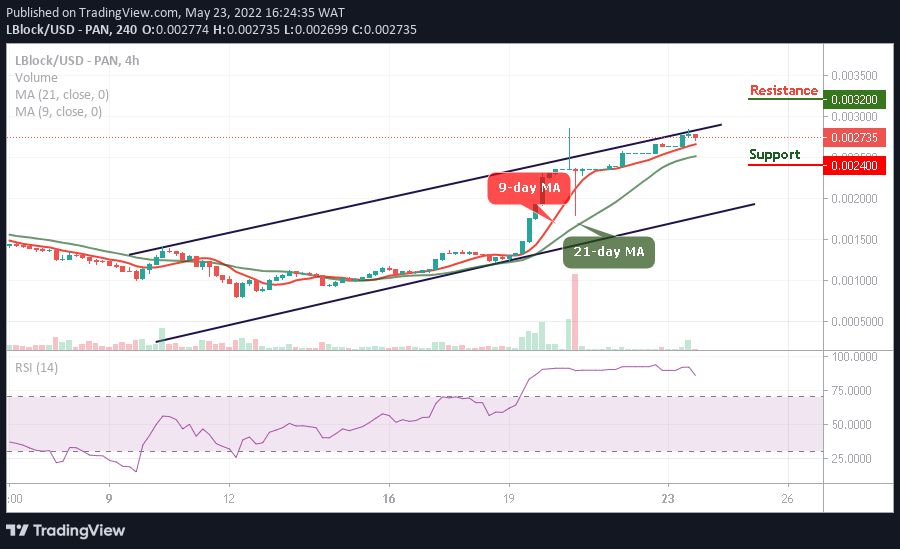
Meanwhile, any further bullish movement will push LBLOCK/USD to the resistance level of $0.0032 and above. On the contrary, if the price drops and crosses below the moving averages, it could hit the critical support at $0.0024 and below, giving more buyers to enter the market.
You can purchase Lucky Block here. Buy LBlock