Lucky Block Price Prediction: LBLOCK/USD Moves to the Upside
Estimated Reading Time: 3 minutes
Don’t invest unless you’re prepared to lose all the money you invest. This is a high-risk investment and you are unlikely to be protected if something goes wrong. Take 2 minutes to learn more

Free Crypto Signals Channel
According to the 12-hour chart, the Lucky Block price rides the bulls as traders are having a great moment ahead.
LBLOCK/USD Long-term Trend: Bullish (12H Chart)
Key Levels:
Resistance levels: $0.0035, $0.0037, $0.0039
Support levels: $0.0018, $0.0016, $0.0014
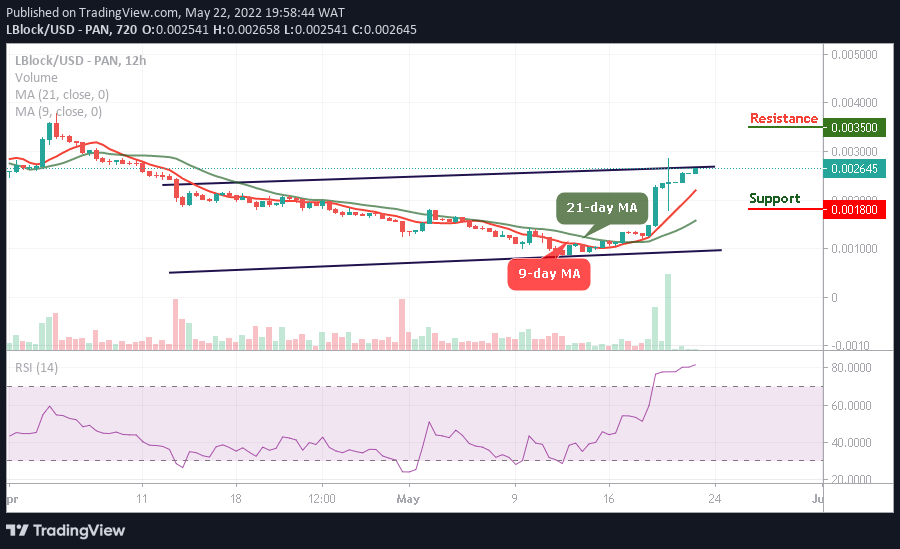
A bullish run may continue to play out as long as LBLOCK/USD increases their entries. Following the recent price, LBLOCK/USD is currently facing a potential resistance level at the $0.0026 level above the 9-day and 21-day moving averages. A break above the barrier would produce a huge green candle across the upper boundary of the channel, marking resistance at $0.0035, $0.0037, and $0.0039 levels.
Lucky Block Price Prediction: LBLOCK Price Heads to the North
The Lucky Block price is moving bullishly as the coin stays above the 9-day and 21-day moving averages. On the contrary, any slight retreat below the 9-day MA may bring the market to cross back to the south with a possible slide to the support levels of $0.0018, $0.0016, and $0.0014, which could give room for the new buyers to enter the market. Looking at the chart, the technical indicator Relative Strength Index (14) moves within the overbought region to increase the bullish movement.
LBLOCK/USD Medium-term Trend: Bullish (4H Chart)
The Lucky Block price is attempting to cross above the upper boundary of the channel, but as it appeared, there’s a low amount of buying pressure in the market which is why the price is finding it difficult to gain more upsides but this could be a good opportunity for new investors to come into the market.
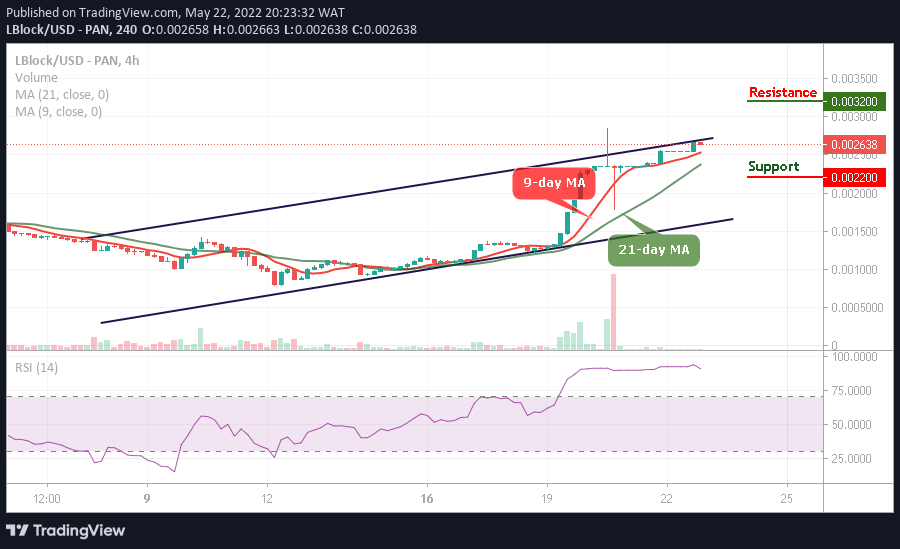
On the contrary, if the bears try to break down the price, one would expect the market to touch the support level of $0.0022 and below. Meanwhile, a bullish continuation would push the price to the resistance level of $0.0032 and above as the technical indicator Relative Strength Index (14) moves within the overbought region.
You can purchase Lucky Block here. Buy LBlock