$SPONGE (SPONGE/USD) Holds Strong at $0.000047 Amidst Market Turbulence
Estimated Reading Time: 2 minutes
Don’t invest unless you’re prepared to lose all the money you invest. This is a high-risk investment and you are unlikely to be protected if something goes wrong. Take 2 minutes to learn more

The $SPONGE market has remained stalled around the $0.000045 price level since the last analysis. Despite a series of rapid price fluctuations, the price has consistently returned to the $0.000045 level. Additionally, there has been a noticeable increase in market volatility while the price action remains stalled. This new crypto signal can be interpreted in several ways.
Key Market Dynamics:
- Resistance Levels: $0.0010, $0.0011, and $0.0012
- Support Levels: $0.000035, $0.000030, and $0.000025
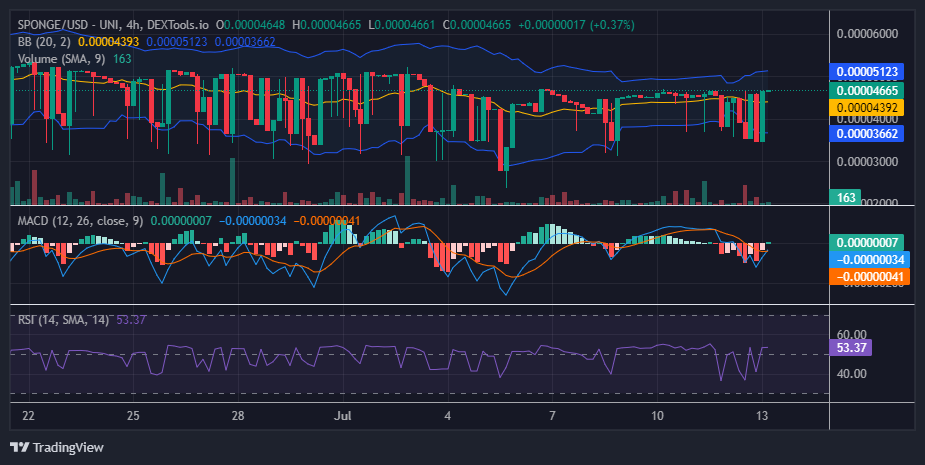
$SPONGE (SPONGE/USD) Technical Outlook
While price action remains at this critical resistance level, volatility is increasing. This is evident in the Bollinger Bands, which were previously narrowing but are now widening. The widening of the bandwidth indicates growing volatility. Although the price has surged to this critical resistance level, traders are becoming undecided, unsure of which side of the market to take. In such cases, a breakout may occur. If the $SPONGE bulls can break above the current $0.00004665 level, it will likely encourage other traders to join the market. However, if the price action fails to break above this level, the wild swings may continue.
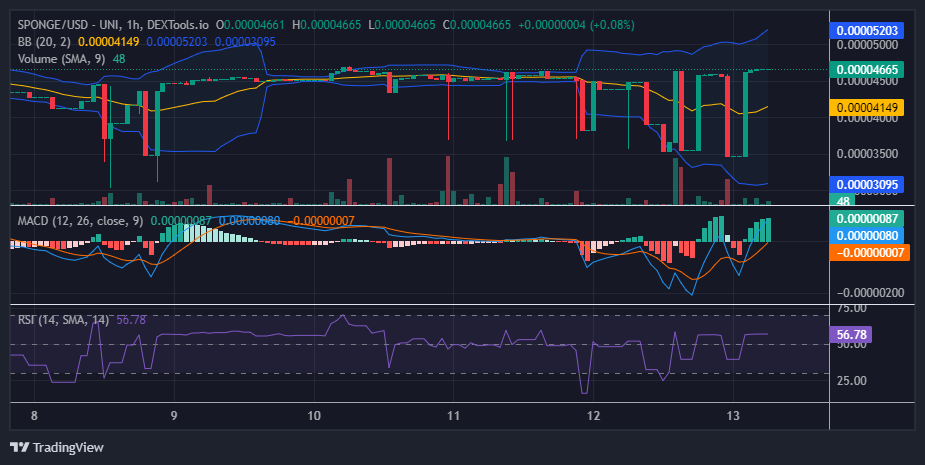
SPONGE/USD 1-Hour Chart Insights
Analyzing the market through the 1-hour chart, we observe the price action stalled at a key resistance level for three consecutive trading sessions, exhibiting a four-price doji. This pattern raises caution among bullish traders, as it suggests a potential drop or reversal unless a catalyst drives the market higher. The appearance of the doji candlestick over these three sessions indicates bullish exhaustion and a possible reversal.
Comparing the last doji candlestick with the volume histogram reveals substantial trading interest. However, if this interest continues to encounter the current resistance, the market might eventually reverse as bullish traders yield to bearish pressure.
Buy SPONGE/USD!
#AltSeason is coming.
Buy the dip. 🧽 pic.twitter.com/H52P34i63r— $SPONGE (@spongeoneth) June 29, 2024