Sponge (SPONGE/USD) Is on the Rise
Estimated Reading Time: 3 minutes
Don’t invest unless you’re prepared to lose all the money you invest. This is a high-risk investment and you are unlikely to be protected if something goes wrong. Take 2 minutes to learn more
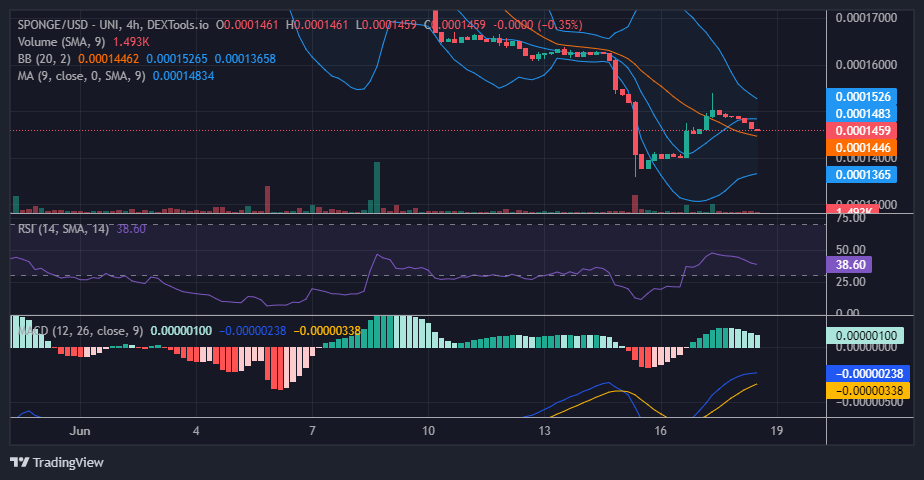
The $0.00014 price level is expected to be the SPONGE/USD’s last line of defense after aggressive bearish sentiment made the market fall from the $0.00015 price zone. Due to the aggressively bearish market, the new support level fell slightly below $0.00014. At the $0.0001375 price level. From here, the market rallied back to $0.00014. Bulls successfully reclaimed the $0.00014 price level as their support level after a significant faceoff between demand and supply at the level.
Key Levels
- Resistance: $0.0004, $0.0045, and $0.0005.
- Support: $0.00015, $0.00014, and $0.00013.
Sponge (SPONGE/USD) Price Analysis: The Indicators’ Point of View
The SPONGE/USD bears have now been forced to form resistance at the $0.00015 price level. According to the Relative Strength Index (RSI), the significant bullish price recovery that we can see from the 4-hour chart is a recovery from the oversold region, and it is a concern that the market did not reach the 50.00 level before its retracement. But the Bollinger Bands respond well to this bullish recovery. The bands contract to reflect the Sponge bull market catching up with the bear market. As long as the market remains above the 20-day moving average, its bias remains bullish. What is needed now is a support level to stop the price retracement so that buyers can pressurize the $0.00015 resistance level.
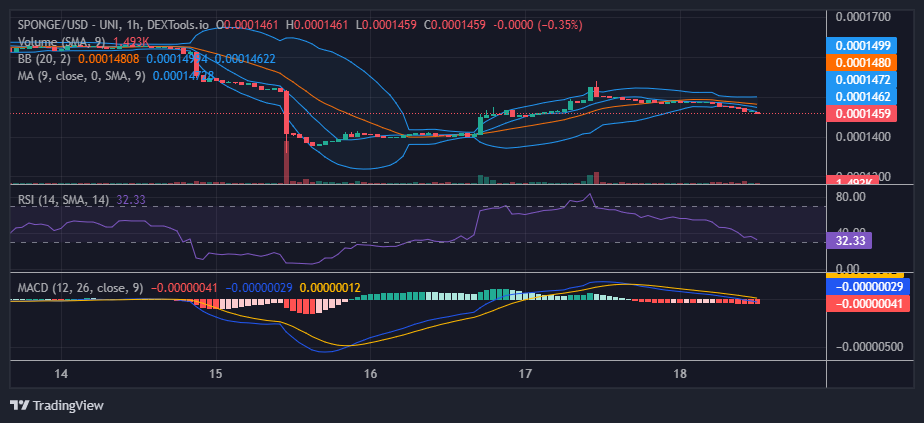
Sponge Short-Term Outlook: 1-Hour Chart
In the 1-hour chart outlook on the market, the price retracement appears to be going too far, as the market is now below both the 20-day moving average and the 9-day moving average. However, around $0.0001459, the appearance of a doji suggests that a support level may form here and the bullish move may continue from here. Also, in the Relative Strength Index (RSI), the market is at the 32.33 level, close to the threshold of oversold; there is more probability for the market to rise at this level.
The Sponge airdrop is still ongoing; don’t be left out.
🌊Are you prepared to secure your spot on the $SPONGE #Airdrop leaderboard?🏆
🌊Season 1 is in full swing, and the excitement is huge!💪🧽
🌊Boost your points by holding and trading $SPONGE!💸🔄
🌊Explore the latest rankings on the leaderboard today!🔍https://t.co/LaiRot6tLJ pic.twitter.com/Xm2ZlL17VE
— $SPONGE (@spongeoneth) June 18, 2023
Invest in the hottest and best meme coin. Buy Sponge ($SPONGE) today!