Polkadot Is in a Minor Retracement, Finds Support above $18
Estimated Reading Time: 2 minutes
Don’t invest unless you’re prepared to lose all the money you invest. This is a high-risk investment and you are unlikely to be protected if something goes wrong. Take 2 minutes to learn more

Free Crypto Signals Channel
Polkadot (DOT) Long-Term Analysis: Bearish
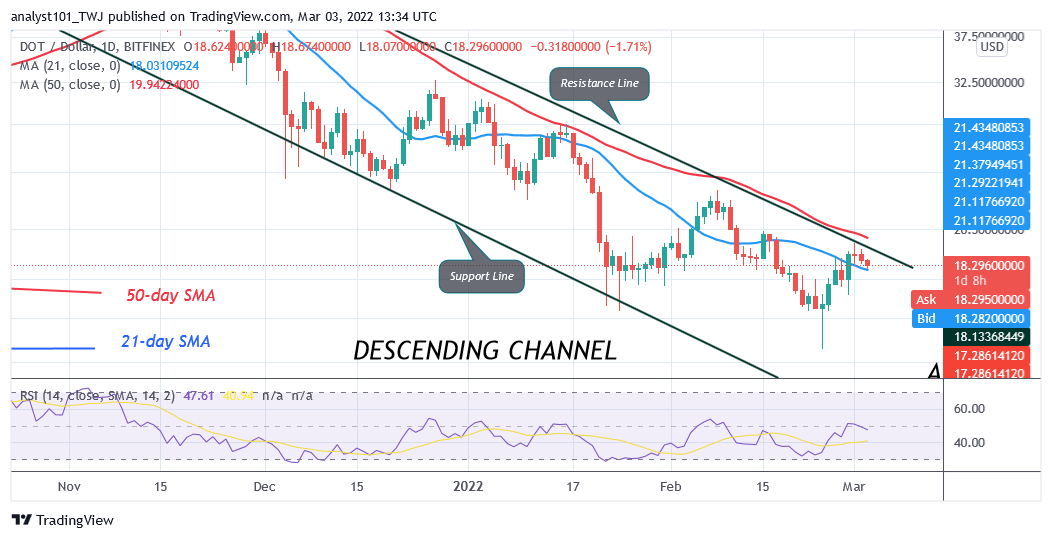
Polkadot’s (DOT) price is in a downward correction as it finds support above $18. The cryptocurrency is in a minor retracement above the 21-day line moving average. If DOT price finds support above the 21-day line SMA, Polkadot will be compelled to a range-bound move between the moving averages. A break above the 50-day line SMA will compel Polkadot to resume an uptrend. On the other hand, if price breaks below the 21-day line SMA, DOT/USD will fall and revisit the previous low at $16. Also, the cryptocurrency will resume downward correction.
Polkadot (DOT) Indicator Analysis
The crypto’s price is below the 50-day line SMA but above the 21-day line SMA. This indicates that the market will be compelled to a range-bound move. The altcoin is at level 47 of the Relative Strength Index period 14. It is in the downtrend zone and below the centerline 50. DOT/USD price is below the 50% range of the daily stochastic. The market is in a bearish momentum.
Technical indicators:
Major Resistance Levels – $48, $52, $56
Major Support Levels – $32, $28, $24
What Is the Next Direction for Polkadot (DOT)?
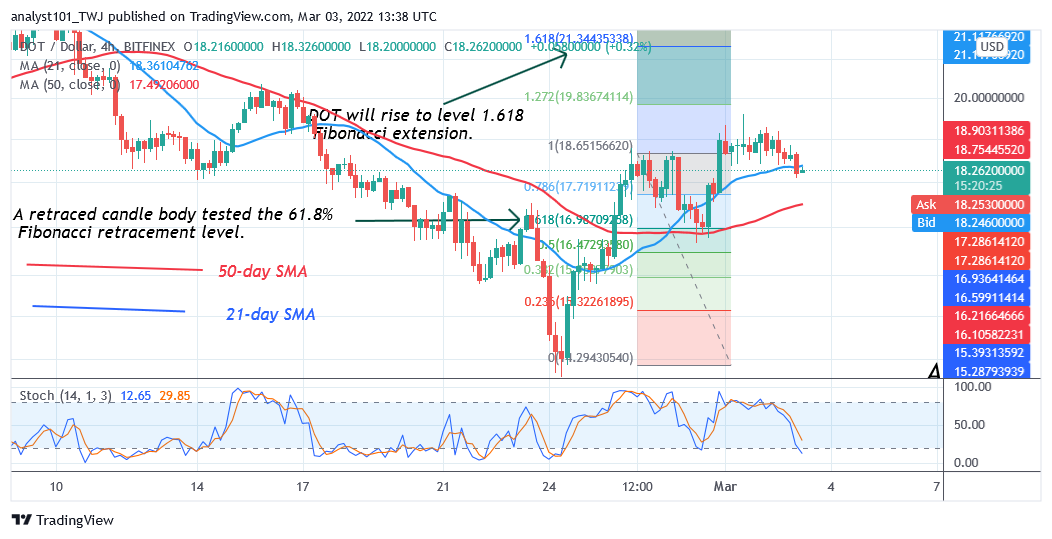
DOT/USD is in an upward move as it finds support above $18. The altcoin has retraced the $18 low and may further decline. However, the upside momentum will resume if the initial resistance is breached. Meanwhile, on February 26 uptrend; a retraced candle body tested the 61.8% Fibonacci retracement level. The retracement suggests that DOT will rise to level 1.618 Fibonacci extension or level $21. From the price action, DOT price is retracing and the Fibonacci tool will hold if the resistance at $19 is breached.
.
You can purchase crypto coins here. Buy LBlock
Note: Cryptosignals.org is not a 1a financial advisor. Do your research before investing your funds in any financial asset or presented product or event. We are not responsible for your investing results