$SPONGE (SPONGE/USD) Market Outlook: Accumulation Phase Points to Breakout Potential
Estimated Reading Time: 2 minutes
Don’t invest unless you’re prepared to lose all the money you invest. This is a high-risk investment and you are unlikely to be protected if something goes wrong. Take 2 minutes to learn more

The SPONGE/USD market is showing signs of strength as it continues to trade in a narrow range. This extended consolidation, centered around the $0.00009 level, suggests that traders are quietly accumulating positions. Such sideways movement often lays the groundwork for an explosive move once momentum shifts.
Crucial Price Zones
- Resistance: $0.000115, $0.000120, $0.000130
- Support: $0.000090, $0.000085, $0.000080
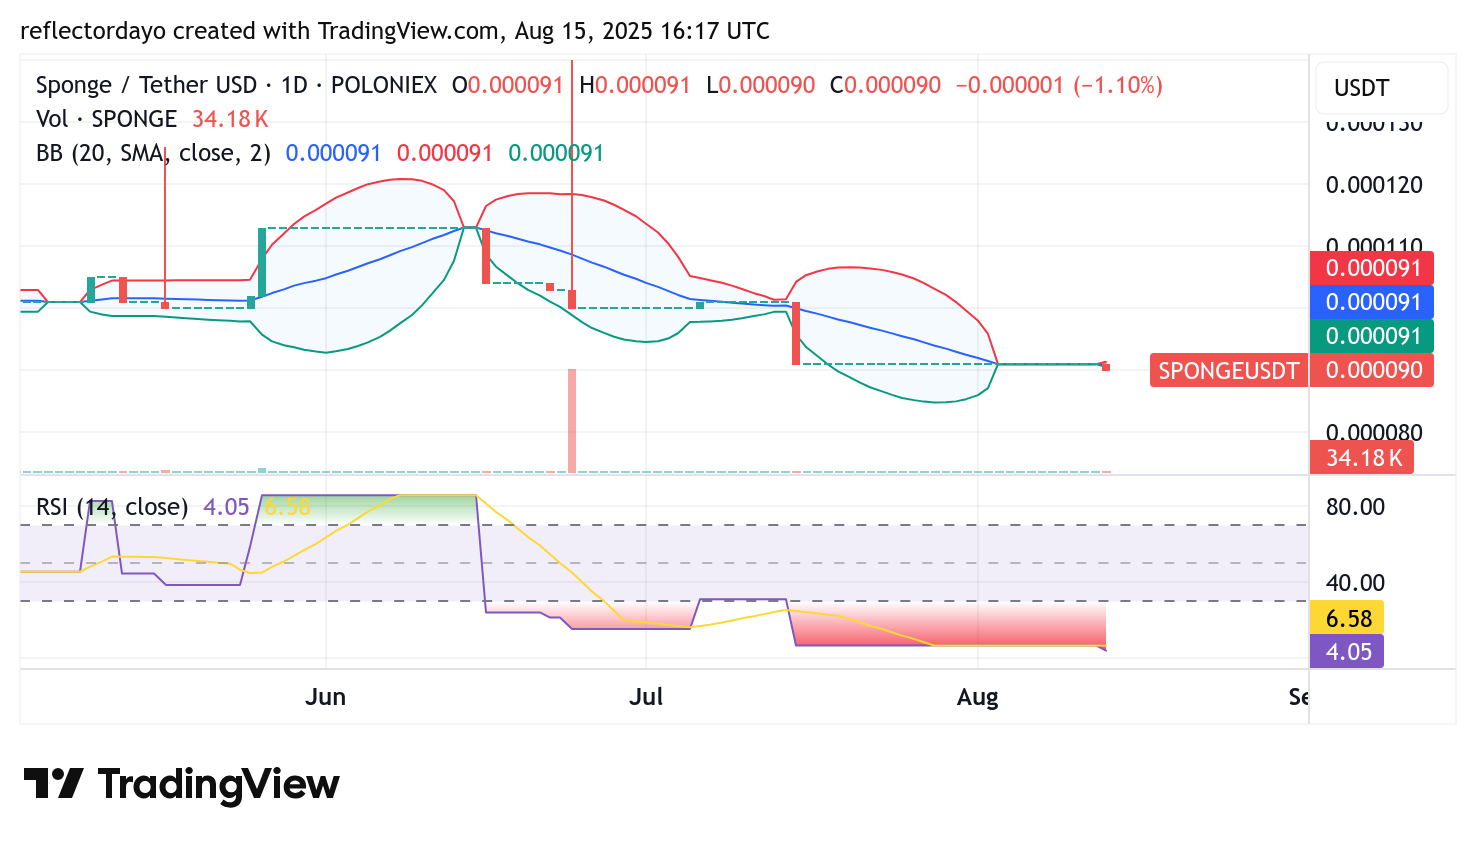
$SPONGE Daily Chart Overview: Bollinger Band Squeeze Signals Possible Upswing
On the daily timeframe, the Bollinger Bands have contracted noticeably, reflecting reduced volatility. This type of compression typically signals an upcoming breakout as market momentum reloads. With price action clinging to the $0.00009 region—just above key support—SPONGE/USD traders may be positioning themselves for the next directional move.
The Relative Strength Index (RSI) has dipped into oversold levels, pointing to weakening bearish pressure and improving odds of a bullish reversal. Combined, these technical indicators highlight the potential for a sharp upside push once fresh buying energy enters the market.
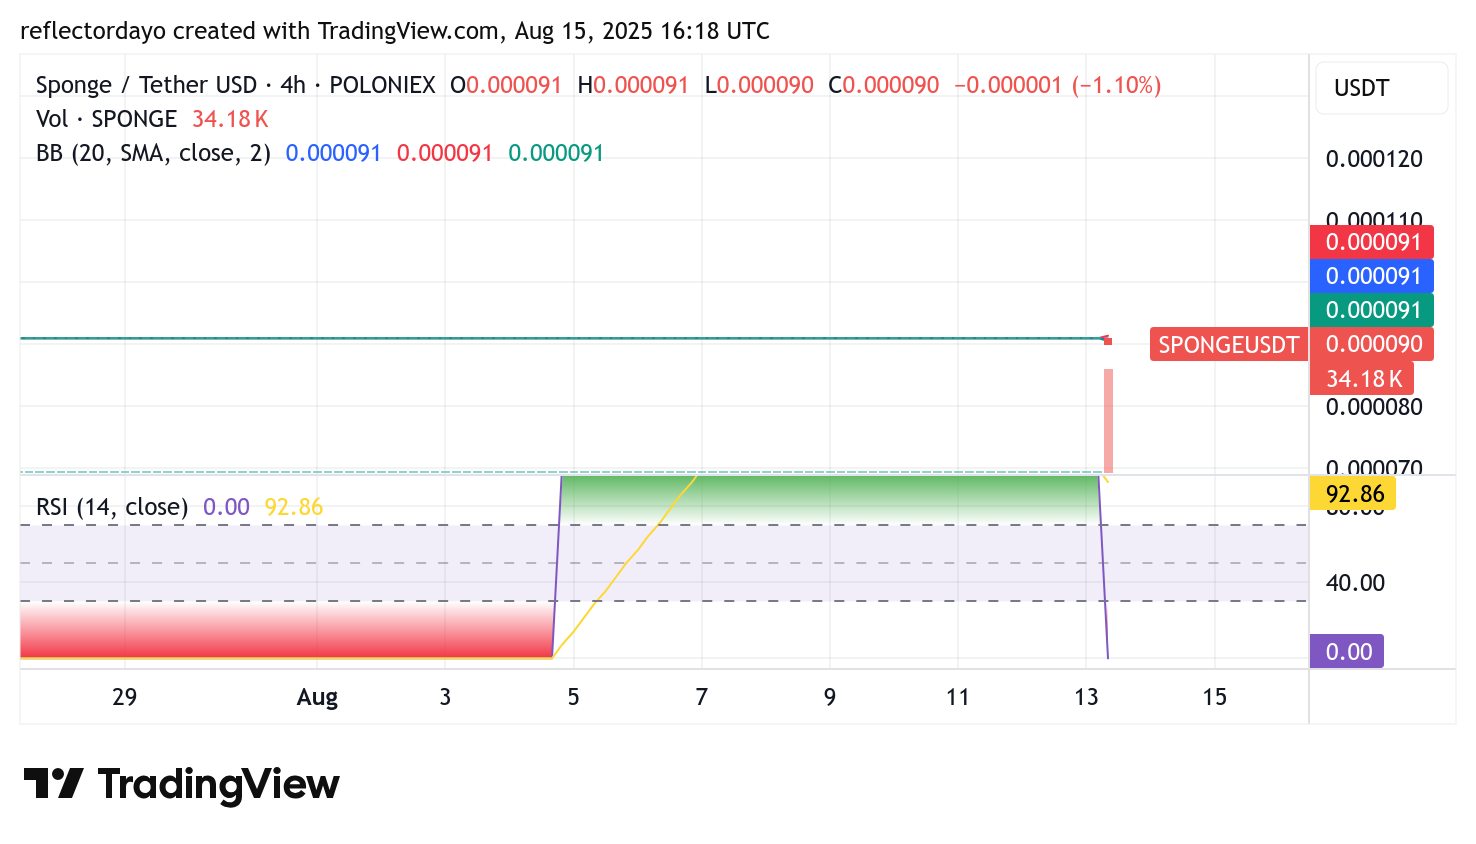
SPONGE/USD 4-Hour Chart Check: Buyers Defending Key Support
Zooming into the 4-hour chart, SPONGE/USD shows the RSI dropping deep into oversold territory, while trading volume has picked up. This surge in activity suggests market participants are actively accumulating.
The pair is locked in a tight range, with buyers holding the line at support. Such patterns often mark the late stages of accumulation, serving as a springboard for an eventual breakout once bullish sentiment takes hold.
Buy SPONGE/USD!
Waiting for meme season to hit like pic.twitter.com/9ZPhYzk60I
— $SPONGE (@spongeoneth) August 6, 2025
Join the SPONGE community and get in on the next big crypto opportunity! Buy Sponge ($SPONGE) today