$SPONGE (SPONGE/USD) Poised for Bullish Surge from $0.000055 Level
Estimated Reading Time: 2 minutes
Don’t invest unless you’re prepared to lose all the money you invest. This is a high-risk investment and you are unlikely to be protected if something goes wrong. Take 2 minutes to learn more

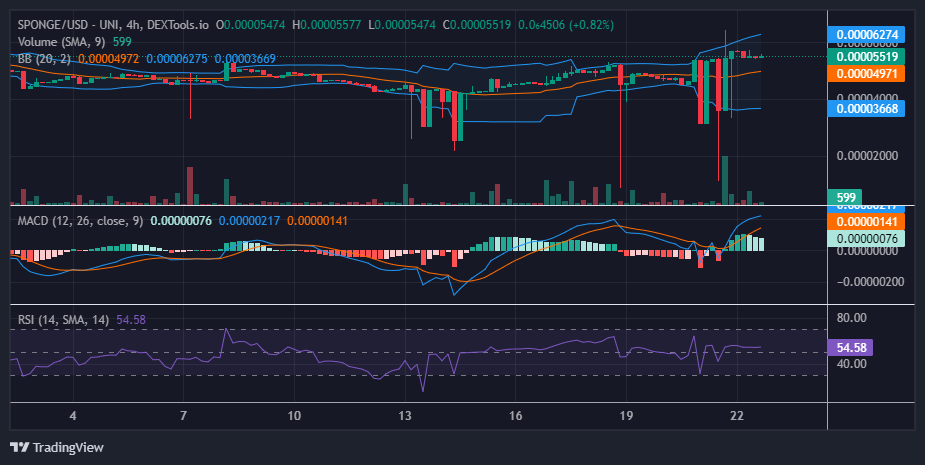
In the previous analysis of the SPONGE/USD market, we noted a burst of market volatility without a clear directional trend. However, in the final four-hour session yesterday, bullish momentum emerged, bringing the price to around the $0.000055 level. In today’s trading activities, the price action has maintained this level as bulls have held their ground, attempting to prevent a market decline.
Key Market Dynamics:
- Resistance Levels: $0.0010, $0.0011, and $0.0012.
- Support Levels: $0.000035, $0.000030, and $0.000025.
Delving into Technical Analysis for $SPONGE (SPONGE/USD)
The bulls’ consistent support around the $0.000055 price level is evident as the Bollinger Bands indicator begins to exhibit an upward trajectory. Both the two standard deviation bands and the 20-day moving average are starting to trend upward.
Furthermore, the Moving Average Convergence Divergence (MACD) indicator still shows two of its lines and histograms above the zero line, suggesting continued bullish dominance. However, bearish resistance is not absent.
The fading green of the bullish histograms on the MACD hints at potential bearish opposition at the current $0.000055 price point. A clear battle for control of this level is unfolding between demand and supply.
Based on the combined crypto signals from the Bollinger Bands and MACD indicators, the bulls appear to hold a slight advantage over the bears for the moment.
Insights from the 1-Hour Perspective
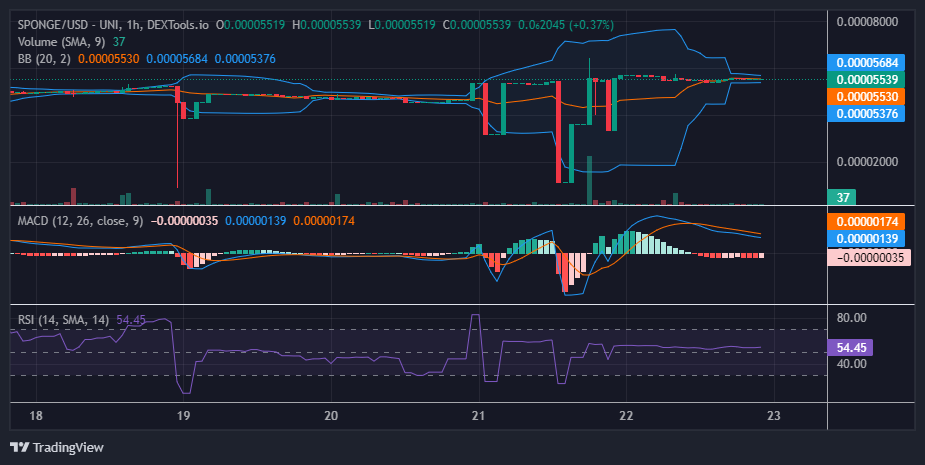
From the perspective of a 1-hour chart, the high level of volatility is cooling off as the Bollinger Bands have begun to converge, forming a narrow price channel. This market dynamic is a precursor to a decisive movement. As noted in the previous analysis, market stability is crucial for progress. Once stability is achieved, $SPONGE could potentially target higher levels.
Buy SPONGE/USD!
Did you fade $SPONGE again, anon? #SpongeV2 #Crypto #ElonMusk pic.twitter.com/TPgxfIZRhF
— $SPONGE (@spongeoneth) May 16, 2024
Invest in the hottest and best meme coin. Buy Sponge ($SPONGE) today!