Bitcoin (BTC/USD) Continues to Hover Underneath the $35,000
Estimated Reading Time: 3 minutes
Don’t invest unless you’re prepared to lose all the money you invest. This is a high-risk investment and you are unlikely to be protected if something goes wrong. Take 2 minutes to learn more
Bitcoin Price Prediction – June 27
The market operation of BTC/USD continues to hover underneath the $35,000 resistance level. The US Dollar has continually put the flagship crypto to trade around $32,902 value at a rate of about 1.70 percent.
BTC/USD Market
Key Levels:
Resistance levels: $35,000, $40,000, $45,000,
Support levels: $30,000, $25,000, $20,000
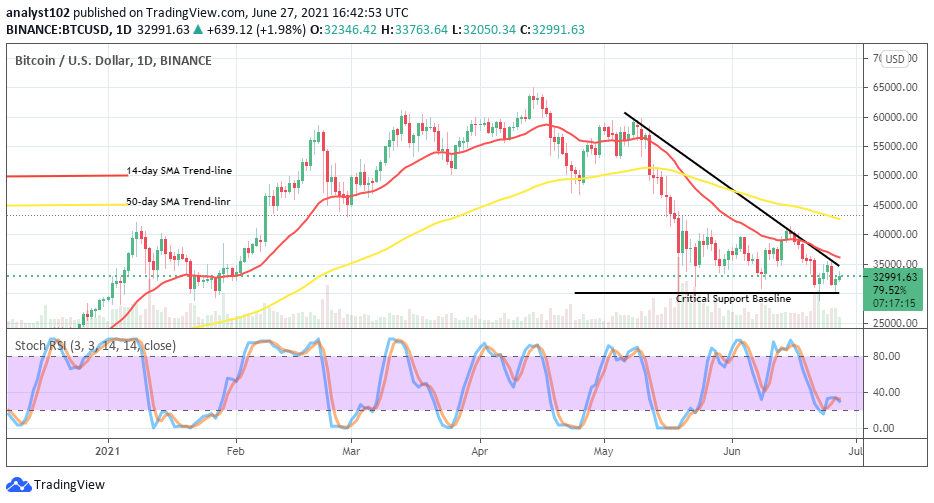
BTC/USD – Daily Char
The BTC/USD daily chart depicts that the market level at $30,000 still features a critical support baseline. And, yet, the baseline has a relevant role in determining the ends of some decline forces that recently featured in the market also the rebounding attempts so far in the crypto economy. There is a notable space between the SMAs as they point to the south over the current trading zone of the market. The 14-day SMA trend-line and the bearish trend-line are closely situated over the immediate resistance level of $35,000 as the 50-day SMA indicator is above them. The Stochastic Oscillators have slightly moved northbound to close the lines near below range 40. That could be a warning signal against seeing a smooth ride to the upside.
Could the BTC/USD market operation continue to find strong support around the point at $30,000?
Over a couple of trading days’ sessions, the BTC/USD market level of $30,000 has witnessed variant breakdowns and rebounds. As a result, it could now be technically ideal that that point has the potentiality of remaining as the critical support baseline for a long time. The market has concentrated on featuring around the immediate resistance level and the level earlier mentioned. Therefore, bulls are to be on the lookout for buy opportunities while price makes a pull-down.
Price has to pull up for a test of around $35,000 line so that bears could have a better chance of holding back the control of the market. However, that assumption appears not achievable in the near session. Therefore, the market may have to continually lower around the immediate support level. And, bears are to stop shorting their stances further around that lower trading zone.
BTC/USD 4-hour Chart
Despite the higher expectation of seeing the BTC/USD market operation getting back on the track of appreciation, the crypto market still appears not to have the energy to push in a continuation for recovery away from the lower value of $30,000.The bearish channels are embodying around the trend lines of SMAs. The 50-day SMA indicator is over the 14-day SMA trend-line. The Stochastic Oscillators are in the overbought region trying to make closed lines. That could turn out signaling a return of a downward force. A buy order could exert after a slight breakdown and a rebound at the value earlier mentioned.
Note: new.cryptosignals.org is not a financial advisor. Do your research before investing your funds in any financial asset or presented product or event. We are not responsible for your investing results.
You can purchase crypto coins here. Buy Tokens