$SPONGE (SPONGE/USD) Potential: Riding the Ripple at $0.000035
Estimated Reading Time: 3 minutes
Don’t invest unless you’re prepared to lose all the money you invest. This is a high-risk investment and you are unlikely to be protected if something goes wrong. Take 2 minutes to learn more
The SPONGE/USD market stands resilient, absorbing the tides of fluctuation, with demand and supply converging along the $0.000035 price level. For investors, this juncture presents an opportunity akin to catching the perfect wave for optimal returns. Historically, since this level represents the starting point of the market last year, there is a strong indication that the price may not decline further than this. Therefore, placing a trade here definitely presents an opportunity for investors to maximize profit.
Key Market Dynamics:
- Resistance Levels: $0.0010, $0.0011, and $0.0012.
- Support Levels: $0.00040, $0.00035, and $0.00030.
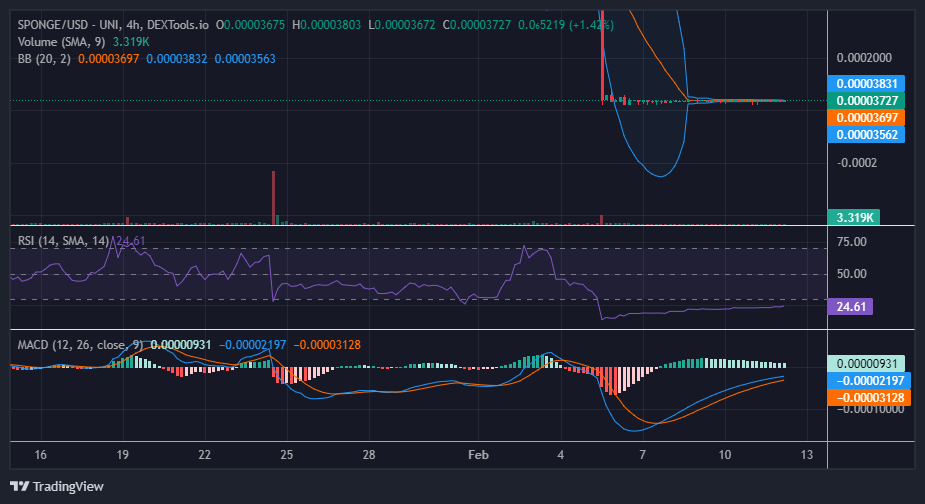
In-Depth Technical Analysis for $SPONGE (SPONGE/USD)
The convergence of the Bollinger Bands into a narrow price channel is a sign of a significant decrease in market volatility. While low volatility implies a potentially flat SPONGE/USD market, the squeeze can also precede a breakout in volatility. Imagine compressing a spring; upon release, it expands rapidly. Similarly, the low volatility period can accumulate energy, potentially leading to a sudden and significant price movement, hopefully in a bullish direction.
One compelling reason to anticipate a bullish price breakout is because our trusty compass, the Relative Strength Index (RSI), presents a crypto signal that indicates a gradual shift in momentum. While it once languished below the 30 mark, a faint glimmer of bullish energy emerges as it climbs from around 14 to 24. Meanwhile, the MACD indicator hints at a potential bullish turn, with negative histograms transitioning into verdant hues, suggesting the strengthening of bullish undertows, although not yet reflected in price action.
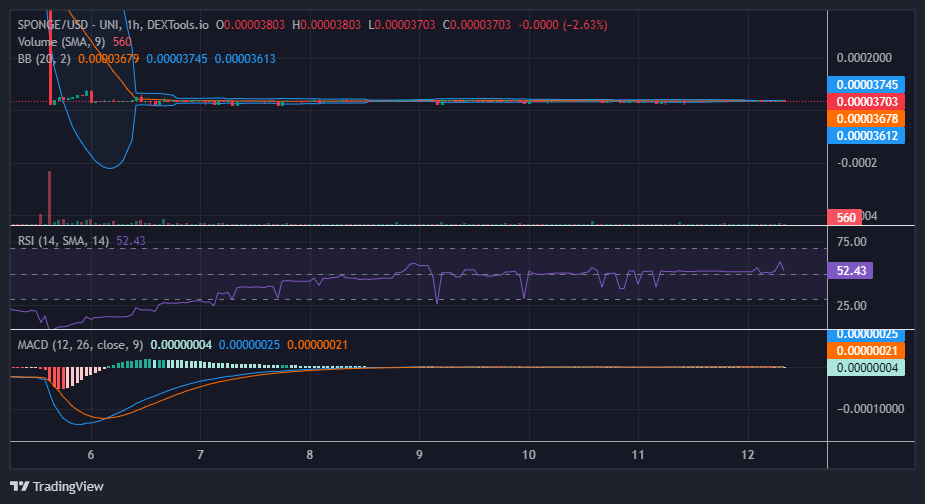
Insights from the 1-Hour Perspective:
Zooming in reveals a narrowing price channel, mirroring the tranquility before a storm. The 20-day moving average acts as our guiding star, guiding us through the labyrinth of market fluctuations. Yet, amidst this calm, a brewing storm of indecision brews, as indicated by the MACD’s conflicting signals, suggesting the market teeters on the brink of a momentous shift.
Buy SPONGE/USD!
People who don’t own $SPONGE be like:#SpongeV2 #Crypto #Bullish #Altcoins #Web3 #100x pic.twitter.com/4CmN7thXAW
— $SPONGE (@spongeoneth) February 12, 2024
Invest in the hottest and best meme coin. Buy Sponge ($SPONGE) today!