$SPONGE (SPONGE/USD) Price Surges 75% to $0.000035
Estimated Reading Time: 3 minutes
Don’t invest unless you’re prepared to lose all the money you invest. This is a high-risk investment and you are unlikely to be protected if something goes wrong. Take 2 minutes to learn more

Our previous analysis of the SPONGE/USD market highlighted a pronounced bearish trend. This downward momentum intensified after the price failed to break above the $0.000035 resistance level, indicating a prevailing bearish sentiment among traders. Consequently, the price plummeted to $0.00002, a significant support level.
However, today’s market shows a rebound from this support. As anticipated, given the historical tendency for the market to bounce at this specific level, a rally has occurred. The current price stands at $0.000035, a level that has historically attracted both buying and selling interest, suggesting its importance in the market’s dynamics.
Key Market Dynamics:
- Resistance Levels: $0.0010, $0.0011, $0.0012
- Support Levels: $0.000020, $0.0000195, $0.000019
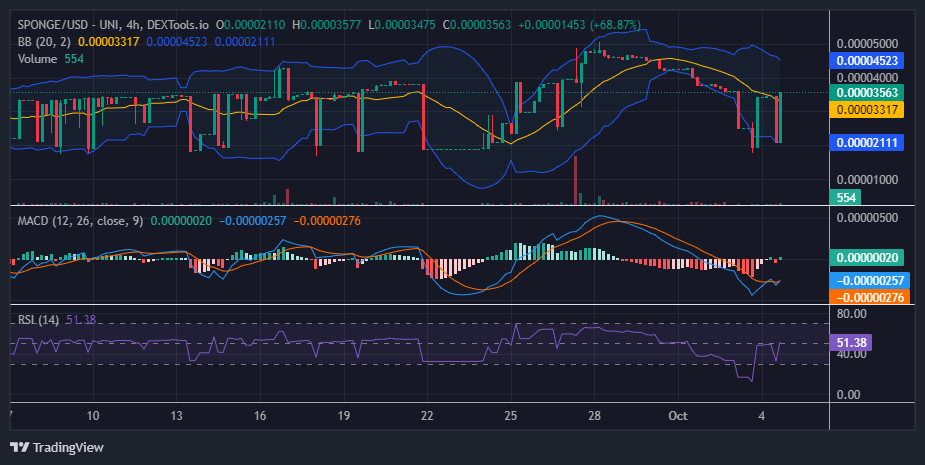
$SPONGE (SPONGE/USD) Technical Outlook
A positive divergence from the $0.000035 price level, despite the current market’s bullish and bearish sentiment, could ignite increased bullish interest. This crypto signal could propel the price towards or even beyond the $0.00005 resistance level. The current bullish momentum, as indicated by the Marubozu candlestick pattern, is gradually pushing prices higher, though remaining relatively close to the $0.000035 level. Investors may be monitoring the next four-hour trading session to determine whether the upward trend will continue or if the market will consolidate at its current equilibrium.
The Bollinger Bands indicator suggests a volatile market environment, implying potential for rapid price fluctuations. However, if the market remains stable in the upcoming trading session, volatility may subside, potentially encouraging traders to adopt a more optimistic stance.
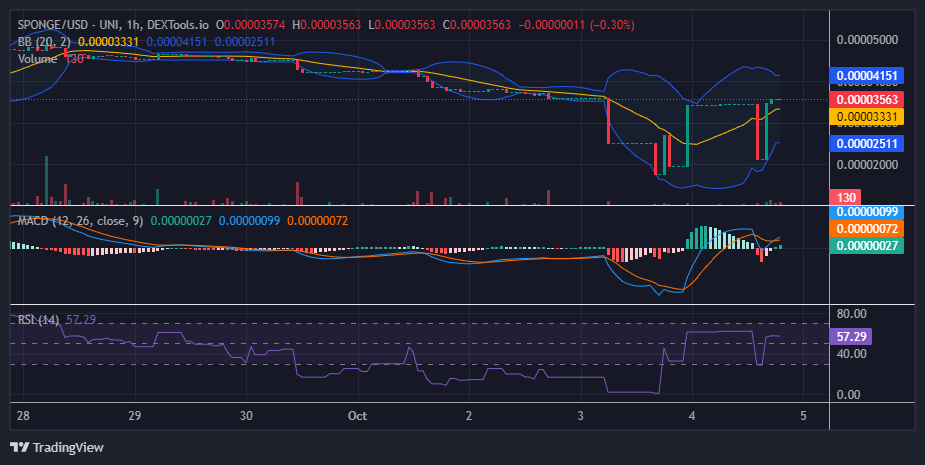
$SPONGE (SPONGE/USD) 1-Hour Chart Insights
The current one-hour trading session is characterized by a four-price Doji candlestick pattern, indicating a state of indecision as buyers and sellers are locked in a struggle around the $0.0000356 price level. This Doji pattern, capping a previous uptrend, is often considered a bearish signal, potentially suggesting a loss of bullish momentum.
As a result of this SPONGE/USD market stalemate, the Bollinger Bands indicator has begun to converge, indicating a decrease in volatility. If buyers can successfully maintain their position above the current price level, there is a possibility of a renewed upward movement.
Buy $SPONGE!
Watch your step ⚡️ pic.twitter.com/zU2ydTKcCs
— $SPONGE (@spongeoneth) September 27, 2024
Join the SPONGE community and be part of the next big crypto sensation! Buy Sponge ($SPONGE) today!


