$SPONGE (SPONGE/USD) Resiliently Holds Ground Above the $0.00045 Price Threshold
Estimated Reading Time: 3 minutes
Don’t invest unless you’re prepared to lose all the money you invest. This is a high-risk investment and you are unlikely to be protected if something goes wrong. Take 2 minutes to learn more
Following a robust bull market that propelled the market beyond the crucial $0.00045 price threshold, the market faced a series of sell orders above this level. Confronted with significant selling pressure above $0.00045, $SPONGE bullish participants navigated these challenges, resulting in a consolidating market. Despite multiple attempts by bullish traders to re-establish control over the bull market, they were unsuccessful. Meanwhile, bearish sentiment has become ensnared within the ranging market. The current market dynamics suggest the potential emergence of a support level.
Critical Price Levels:
- Resistance: $0.00047, $0.00050, and $0.00060.
- Support: $0.000350, $0.00030, and $0.00025.
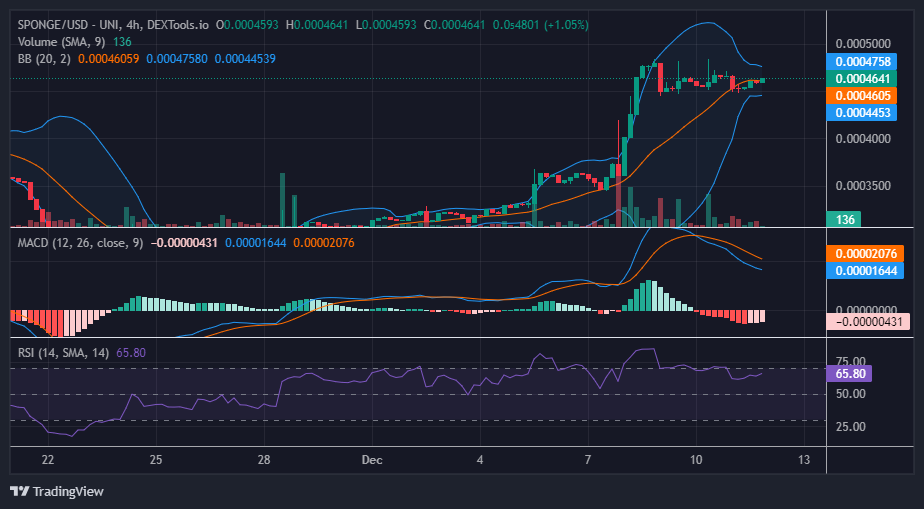
In-Depth Technical Insights for $SPONGE (SPONGE/USD) Price Analysis:
During the sideways consolidation of the $SPONGE market, the Moving Average Convergence and Divergence (MACD) indicator suggests a potential shift towards an upward trajectory. The bearish activities within the consolidation trend are diminishing, as evident in the fading negative histograms, signaling weakness in the bear market. Furthermore, the MACD lines persistently remain above the zero level, indicating that bullish control endures. This indication suggests a potential resurgence of bullish momentum, possibly propelling the market upward from its current position.
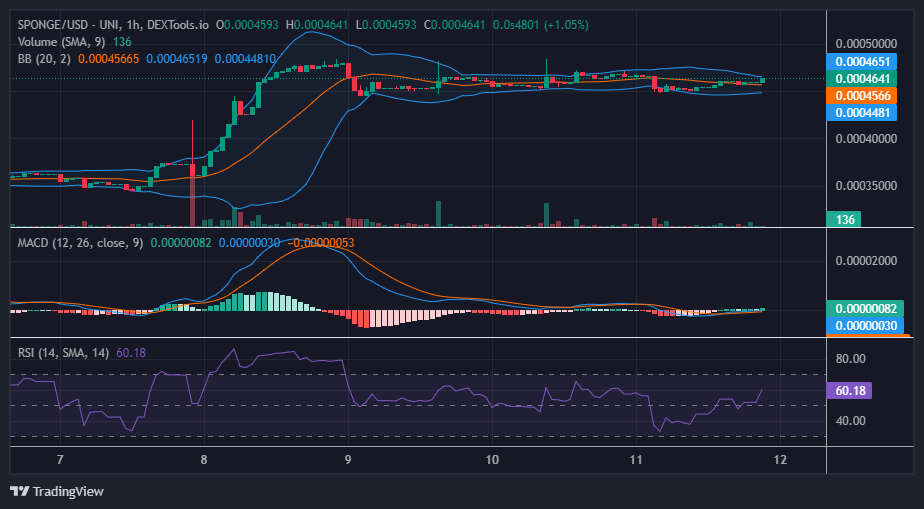
Short-Term Outlook on the 1-Hour Chart:
The Moving Average Convergence and Divergence (MACD) indicator, observed on the 1-hour chart, reveals the convergence of the two lines and the histograms hovering around the zero level. This pattern suggests a consolidation phase around the $0.00046 level. Concurrently, the Relative Strength Index (RSI) signals a potential bullish breakout as the momentum measurement ascends to the 60 level. These indicators collectively indicate that the market may be poised for an upward movement in the near future.
Buy SPONGE/USD!
🚨 Exciting news, #SPONGERS! 🧽
The $SPONGE Airdrop distribution is now complete! https://t.co/iMAdfg9SiS
Check your wallets to see if you’ve made a splash as one of the recipients! 🌊💰#SPONGE #MemeCoin #Airdrop pic.twitter.com/yw7RKVtcg9
— $SPONGE (@spongeoneth) November 7, 2023
Invest in the hottest and best meme coin. Buy Sponge ($SPONGE) today!